A plant engineer walking a new operations leader down the aisle usually starts with the same correction. The question of how AI is used in manufacturing is not which model to buy. It is which decision on this line is still a guess, and whether the plant already captures the signals that would make that decision repeatable.
Most overviews list use cases and promise gains. This walkthrough pairs each use case with the data it consumes and the KPI that has to move. Software can watch every sensor at once, the way a night-shift supervisor wishes they could. It still needs a person, a baseline, and a rule for what happens when the recommendation is wrong.
That framing matters because pilots stall for ordinary reasons. The historian is missing context. Nobody owns the alert. Finance cannot see the scrap, overtime, or energy line the model was supposed to cut. Data readiness and governance, not the brand of model, usually decide whether the investment pays back.
Where AI Fits Across the Factory Floor
Adoption is still early. In 2025, 29% of manufacturers reported using AI or machine learning at the facility or network level, while 24% had deployed generative AI at that scale, according to Deloitte's 2025 Smart Manufacturing Survey. Most plants are still choosing a starting point, not running a plant-wide system.
AI in manufacturing turns machine, quality, energy, and planning data into decisions that run on the line or across the supply chain. Think of it as a night-shift supervisor who watches every sensor at once, then still needs a person to decide what to do about what it sees.
| Use case | What the AI does | Data it needs | Typical KPI |
|---|---|---|---|
| Predictive maintenance | Forecasts failures from vibration, temperature, and pressure patterns | Machine sensor and historian data | Unplanned downtime hours |
| Quality inspection | Flags surface defects and process drift early | Vision images, machine settings, batch records | First-pass yield, scrap rate |
| Robotics and cobots | Adapts assembly, welding, packing, and material handling | Robot cycle data, sensor and vision feeds | Cycle time, throughput |
| Digital twins | Tests schedules and changeovers on a virtual copy of a line | CAD models, process parameters, live machine data | Changeover time, commissioning time |
| Energy management | Predicts consumption and recommends schedules and set points | Energy meter readings, machine states, output volume | kWh per unit |
| Process optimization | Adjusts process parameters to hold quality and yield | Process parameters, quality test results | Yield, unit cost, waste rate |
| Supply chain and demand forecasting | Predicts demand, inventory needs, and supplier delays | Order history, inventory, supplier lead times | Forecast accuracy, fill rate, inventory days |
| Worker augmentation | Guides operators with work instructions, alerts, and training | Work instructions, operator logs, training records | Time to proficiency, first-time-right rate |
Key Takeaways
- Start with data you already log. AI runs on machine data that already exists in sensors, historians, and batch records.
- Pick a common first job. Predictive maintenance and quality inspection are the most common starting points.
- Measure against a baseline. Energy and process gains only count when you compare them with a verified starting point.
- Expect data work first. Data readiness decides how fast results arrive, more than the choice of algorithm.
How Predictive Maintenance and Visual Inspection Work
A fixed service schedule is an annual checkup. The machine is opened on a calendar date whether the bearing is healthy or not. Condition-based AI is continuous monitoring. It raises an alert when the vitals drift, the way a clinic calls you after a week of abnormal readings rather than waiting for the yearly visit.
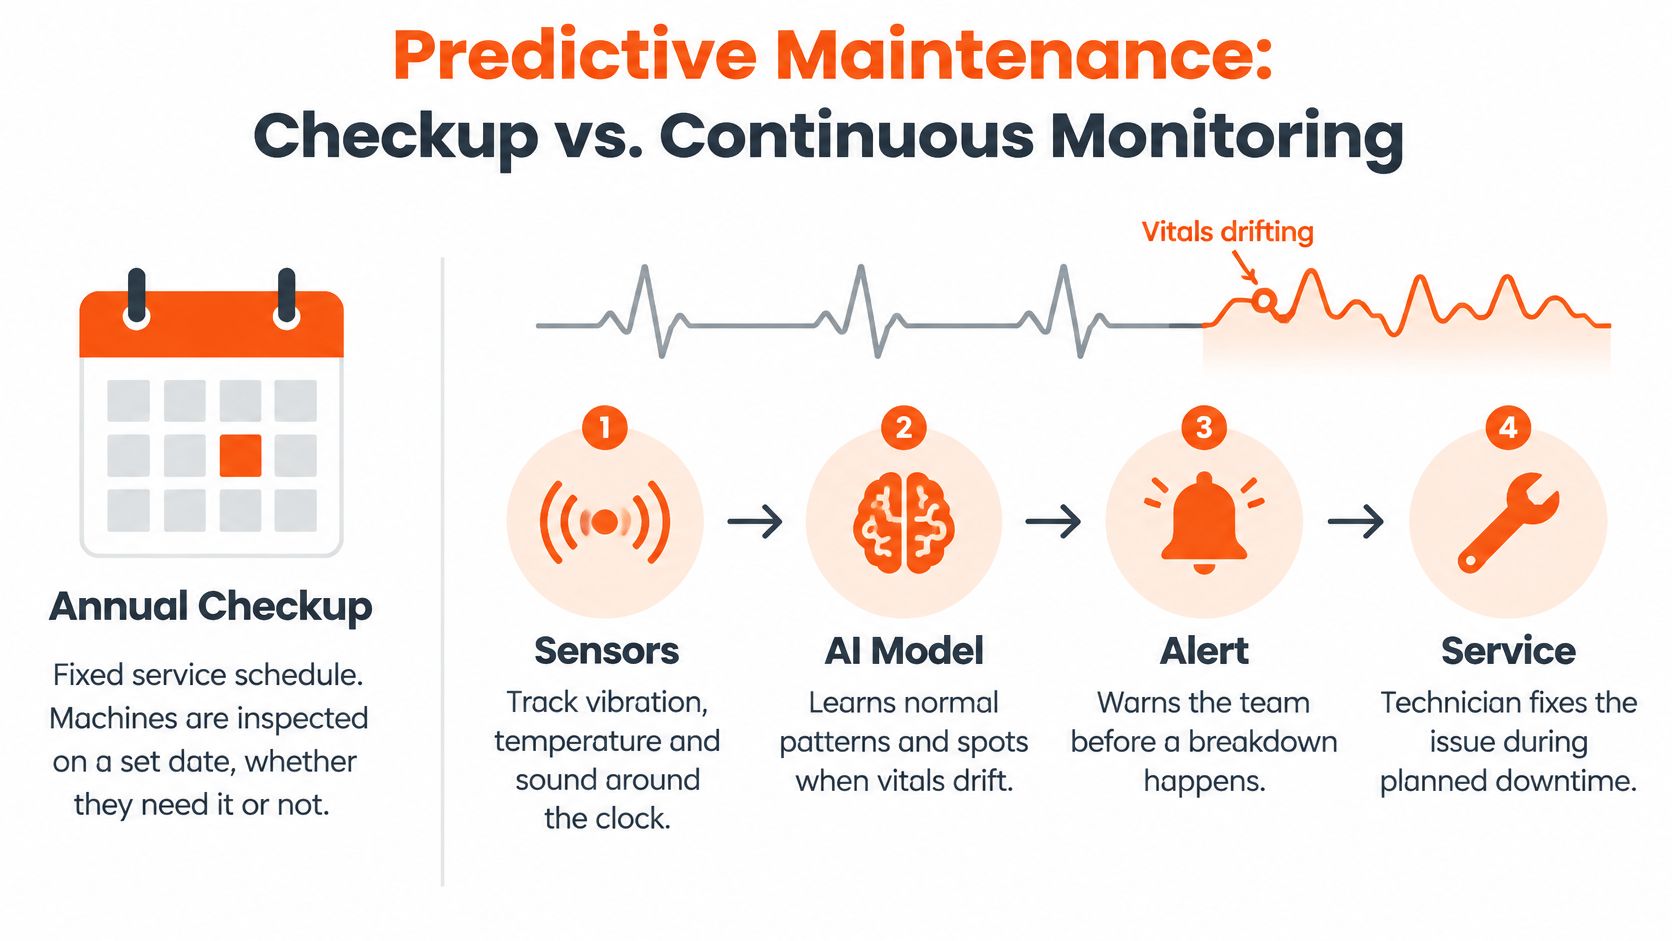
NIST describes industrial AI that reads temperature, vibration, and pressure to spot patterns tied to impending failure. The loop is short, and each step exists for a reason.
- Sensors capture the vitals. Temperature, vibration, and pressure are logged so the model has a history, not a single snapshot.
- Models learn normal patterns for each asset. A spindle and a compressor do not share one "healthy" signature, so the baseline is asset-specific.
- The system forecasts health and raises an alert with a time window. Maintenance gets a lead time, not a siren after the stop.
- The team schedules the work inside planned downtime. The repair lands on a changeover instead of an emergency call.
Practical example. A spindle's vibration trend rises over several days. The alert goes out while the part is still cutting to tolerance. Maintenance replaces the bearing during a planned changeover. The line never takes the unplanned stop, and the spare is already in the crib.
Inspection that corrects the process
Visual inspection is a different outcome, so it should be a different model. Cameras paired with machine settings flag surface defects. Exceptions go to a human reviewer. Nobody pretends the model should replace a check of every part on day one. Corrections feed back into the process before a bad setting fills a rack with scrap.
In 2024, 83% of manufacturers expected to use generative AI in their operations, and quality control ranked as the leading AI and machine-learning use case, according to Rockwell Automation. Watch unplanned stops, first-pass yield, and scrap rate. Buy the model for the outcome you need. Predictive maintenance and quality control are not one generic tool.
A World Economic Forum example makes the control loop concrete. A machine-learning system for sheet-metal forming adjusts production parameters in real time. It reduced scrap, prevented defects, and cut material costs by 12.5%. The model detects process drift, feeds the correction into production controls, and operators fix the process before defective output piles up.
Impact opportunity: On expensive inputs or tight tolerances, a small lift in first-pass yield compounds across the volume you already run. The KPI is scrap and material cost, not a model accuracy score on a slide.
Robots, Cobots and the People Who Work Beside Them
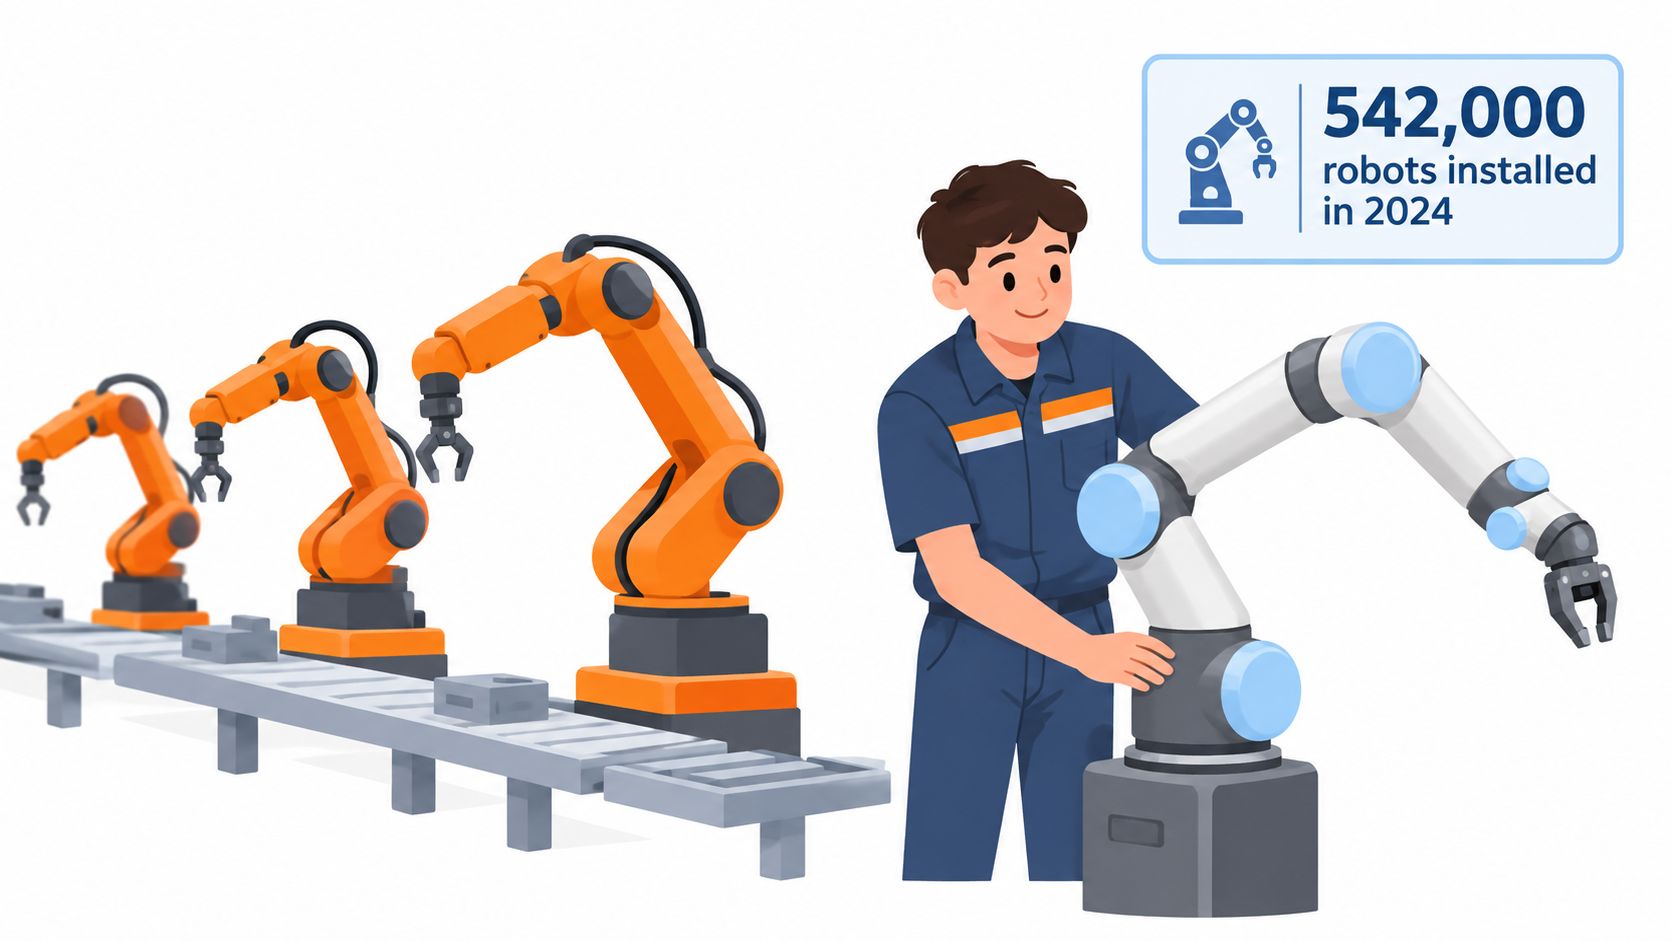
Hardware is arriving on factory floors faster than many plants can absorb it. Factories installed 542,000 new industrial robots worldwide in 2024, more than twice the level of a decade earlier, and the operational stock reached about 4,664,000 units, up 9% from 2023, according to the International Federation of Robotics.
A robot arm by itself repeats a motion. AI is what lets it adjust. Modern units increasingly combine machine learning, computer vision, sensor data, and adaptive control for assembly, welding, material handling, packaging, and inspection. Geography shows where that equipment is landing: Asia accounted for 74% of new deployments in 2024, Europe 16%, and the Americas 9%. China alone installed about 295,000 robots, 54% of worldwide deployments.
The operator beside the cobot
Collaborative robots work beside people without a safety cage, which changes what the operator's job looks like. Cobots exceeded 64,500 units in 2024, nearly 12% of new installations and a 13% year-over-year increase. A year earlier they were more than 57,000 units and over 10% of installations. Global robot density averaged 177 robots per 10,000 employees in 2024, 204 in Asia, 148 in Europe, and 131 in the Americas, as the International Federation of Robotics density figures show.
A cobot works like a capable apprentice. It handles the repetitive motion reliably, but it still needs a journeyman watching for the cases it has never seen.
Hypothetical scenario. Say a cobot on a multi-variant cell adjusts its grip when part dimensions shift across a product family, so the cell runs several variants without a full retool. The operator follows model-guided work instructions on a screen and gets an alert when a torque reading or dimension drifts. In a rollout like this, the metrics worth tracking are time to proficiency for each new hire and how often the operator has to override the cell. Those numbers, not the robot count, tell you whether the automation is helping.
Connected robots only pay when execution systems receive their cycle data and someone is accountable for exceptions. The data a cell needs is unglamorous: clean cycle-time logs, torque and vision traces tied to part IDs, and a record of every stop and override. The KPIs that prove the investment are equipment effectiveness, first-pass quality on the cell, and exception rates. A robot that cannot be stopped cleanly, or whose miss has no owner, is a faster way to make the same mistake.
A short demonstration of cobot handling is linked below.
How Digital Twins and Energy Models Tune Operations
Energy AI runs as a closed loop. It measures consumption at the machine, predicts what a given product or regime should draw, then adjusts schedules and set points. Each stage feeds the next.
| Stage | What the model does | Data it depends on |
|---|---|---|
| Collect | Sensors and industrial controls meter electricity, temperature, and process conditions | Submetered readings, machine state, production context |
| Predict | Machine learning builds an operating baseline and forecasts consumption per product and regime | Historical load curves tied to what the line was producing |
| Recommend | Optimization or reinforcement learning proposes schedules, set points, and maintenance actions | Energy tariffs, quality limits, shift plans |
A review of 67 journal papers groups the technical work into monitoring and prediction, real-time control, scheduling, and parameter optimization, often combining machine learning, deep learning, reinforcement learning, or hybrid digital twins, as Aston University researchers summarize.
Generative AI plays a different part. In 2024, 78% of manufacturers named finding the root cause of production issues as a generative-AI use case, according to ABI Research. That is diagnostic support across the plant floor, and it sits outside the energy control loop.
A factory that grew output and cut intensity
The World Economic Forum's account of Siemens's Chengdu factory offers a proof point. Over three years the plant increased production output by 92% while running digital energy management, predictive maintenance, and AI-based automation able to identify and handle up to 16 types of production waste. Energy consumption per unit fell 24% and production waste fell 48%. The system compares energy use by machine, shift, product configuration, or batch, then recommends a schedule or parameter change. Output and intensity moved together.
A digital twin works like a flight simulator for that schedule. Before a plant shifts an energy-heavy process to off-peak hours or relaxes a set point, engineers replay the change inside the twin. The virtual line runs the new schedule against simulated machine behavior, predicts whether throughput, peak demand, and quality hold, and rejects the variants that fail. Only tested changes reach the live cell. Commissioning time and changeover time are the KPIs, because the twin's job is to keep experiments off production equipment.
Judge energy models against a verified baseline, normalize for volume, and hold them to quality constraints. A recommendation that saves kilowatt-hours by slowing a qualified process is not a win.
Payback is not automatic, and the comparison with older methods is honest. In one three-year study across several factories, AI-enabled energy projects paid back in under a year on average, while conventional non-AI methods delivered larger absolute savings but needed several years to recover their costs. AI looks attractive when you need fast deployment, lower implementation cost, and automatic adaptation. It does not automatically beat a well-run conventional project on total kilowatt-hours.
How AI Forecasts Demand and Steadies the Supply Chain
A demand forecast is a weather report for orders. Past sales are the climate. Seasonality, promotions, and customer signals are the front moving through this week. Spreadsheets can hold a few of those drivers. AI weighs many of them at once and updates when new orders land.
The sequence is plain, and each step fails if the one before it is sloppy.
- Consolidate order history, inventory, and CRM records so sales and operations are not forecasting from different books.
- Group products by demand pattern, because a stable runner and a sporadic spare do not share one model.
- Generate forecasts with confidence ranges so planners see uncertainty, not a single false-precise number.
- Feed those forecasts into production planning and purchasing or the forecast never leaves the analytics folder.
- Review forecast error every week and correct the inputs, not just the chart.
Supplier risk sits on the same data. Models that track lead-time trends can flag a slipping supplier early enough for a planner to reroute or adjust safety stock. A late truck that nobody saw is an idle line. A late truck flagged on Tuesday is a rescheduled job.
Practical example. Start the pilot on the highest-volume products. A small accuracy gain there frees the most working capital. Track forecast accuracy, fill rate, and inventory days. Ignore vanity lift on a long-tail SKU until the runners are stable.
The forecast is only as reliable as the order data behind it. Sales and operations systems have to share one definition of an order, including what counts as a cancellation and what counts as a promise date. If you are mapping those handoffs across planning and commercial systems, the same discipline shows up in AI in supply chain work. One definition, one baseline, then the model.
KPIs That Show Whether AI Is Paying Off
Each use case needs a baseline captured before the pilot starts, one primary KPI, and a fixed review cadence. Without the baseline, a busy month looks like a model win.
| Use case | Baseline to capture | Primary KPI | Review cadence |
|---|---|---|---|
| Predictive maintenance | Twelve months of unplanned stop hours and spare-parts spend | Unplanned downtime hours, mean time between failures | Monthly |
| Quality inspection | Escape rate, scrap, and rework by line | First-pass yield, scrap rate | Weekly |
| Robotics and cobots | Cycle time and labor hours per unit | Throughput, cycle time, robot utilization | Weekly |
| Digital twins | Changeover and commissioning durations | Changeover time, days to commission | Per project |
| Energy management | kWh per unit, normalized for output volume | kWh per unit, energy cost per unit | Monthly |
| Process optimization | Yield, waste, and unit cost before the pilot | Yield, unit cost, waste rate | Per batch |
| Supply chain and forecasting | Forecast error, stockouts, inventory days | Forecast accuracy, fill rate | Monthly |
| Worker augmentation | Training time, error rate, incident rate | Time to proficiency, first-time-right rate, safety incidents | Quarterly |
Read the columns left to right. The baseline is what you record before anyone turns the model on. The primary KPI is the single number that decides go or no-go, even if you watch a second measure. The cadence is how often a named owner compares the live number with that baseline.
Ranges that do not travel
A systematic review of 34 additive-manufacturing studies reported prediction accuracies as high as 98.2%, energy savings from 6.78% to 22%, cost reductions of roughly 44% to 57%, and emissions reductions of about 19% to 22%, as covered in The International Journal of Advanced Manufacturing Technology. Those ranges come from narrow process windows, one machine, material, and part family. They do not transfer to your plant because a paper reported them.
Operational gains and financial gains are not the same result. In 2025 manufacturing research from KPMG, 96% of respondents reported efficiency improvements, but only 45% reported measurable financial improvements. Tie each KPI to a cost line such as scrap, overtime, expedited freight, or energy spend. A practical guide to that translation sits in AI ROI measurement, where the plant number has to survive a finance review.
Practical example. Normalize energy by units produced. A high-volume month will burn more kilowatt-hours and still be a better plant. Report each KPI against the pre-pilot baseline at 30, 60, and 90 days. If the primary KPI has not moved by day 90, stop adding features and fix the data or the workflow.
Common Challenges and How to Fix Them
The stall usually arrives after a convincing demo. The model worked on a cleaned extract. It does not work on the live historian, the night shift will not trust the alert, or nobody can say who answers if the recommendation causes a quality or delivery miss.
| Challenge | Usual cause | Mitigation |
|---|---|---|
| Poor data quality | Records lack equipment state, material variation, and other context | Audit data, standardize tags, add context fields at capture |
| Workforce resistance | Skills gaps and change fatigue on the floor | Involve operators in the pilot and provide role-based training |
| Security exposure | Employees enter trade secrets into public AI tools | Approved tools, defined data boundaries, audit trails |
| Accountability gaps | No owner for AI-driven failures | Assign owners, write escalation rules, keep human override |
| Model drift | Sensor changes, new materials, or geometry changes | Monitor performance, set retraining triggers, keep fallback procedures |
The three barriers that stop scale
Data comes first. A 2025 implementation study found that data-quality and standardization issues represented about 76.5% of implementation barriers. Many operations kept production records, but only 27.4% preserved contextual details such as equipment state, environmental conditions, and material variation, and organizations spent an average of 8.3 months preparing data before generative-AI deployment. Treat the first project as a data-operating-model project. The central question is whether MES, ERP, CRM, historian, and machine data can support one measurable decision.
Workforce resistance is next. The pattern is consistent across plants: operators distrust alerts they had no hand in shaping, experienced staff carry knowledge the model lacks, and training budgets lag behind the tooling. Change management belongs in the project plan from day one. Operators have to be in the pilot, not briefed after go-live. When the people who run the line help set acceptance criteria, the alert becomes a tool they own instead of a system that watches them.
Security is the third. The exposure is specific: an employee pastes process parameters or proprietary research into a public AI tool, and that data leaves the plant's control. The concern is widespread enough that manufacturers are now aiming AI at the problem itself. In 2025, 50% of manufacturers planned to apply AI or machine learning to product quality, and 49% planned to use AI for cybersecurity, according to Rockwell Automation's 2025 smart-manufacturing survey. Approved tools, role-based permissions, and audit trails belong in the design, not in a later policy memo.
Who is accountable when an AI recommendation causes a quality, safety, warranty, or delivery failure? Name that owner before go-live, with escalation rules and a human override.
Before implementation begins, responsibilities, integration points, acceptance criteria, and team training are agreed. That sequence keeps a clever demo from becoming an unowned recommendation on the line.
Practical example. A new material shifts sensor readings and the model drifts. The fix is a retraining trigger plus a manual fallback until the model is revalidated against inspection results. Sensor drift, new materials, and geometry changes will invalidate a model trained on last year's builds. Monitoring is part of the job, not a phase you finish.
Build the Roadmap, Tech Stack and Executive Decision
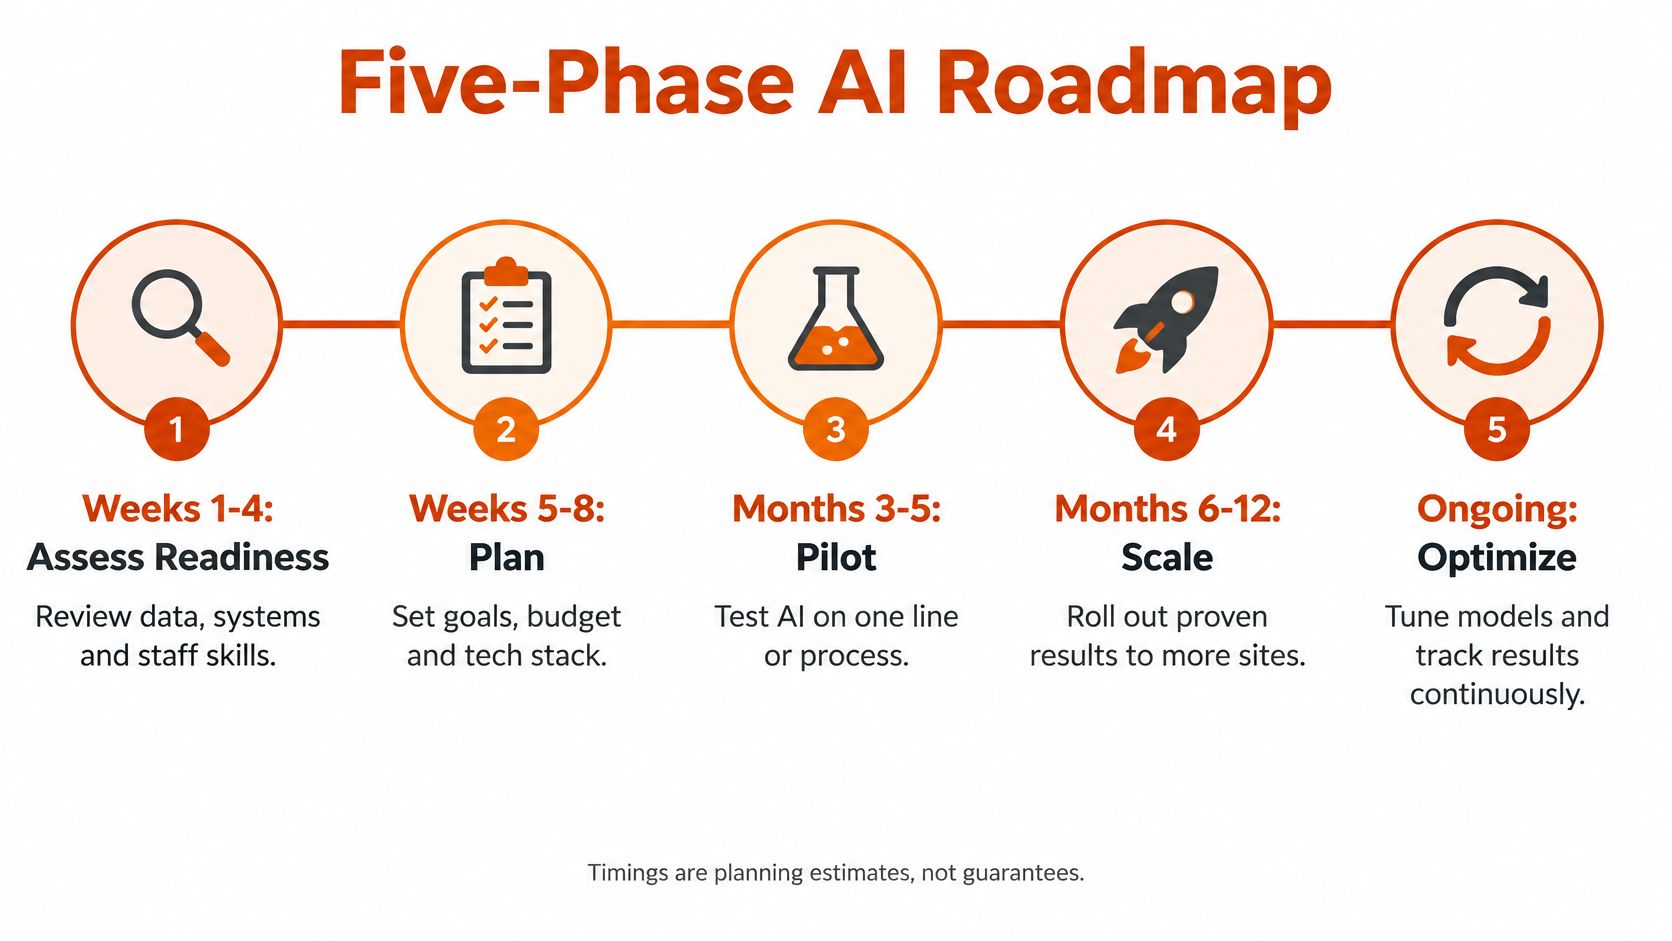
You can act on one cell this quarter. The timings below are planning estimates, not benchmarks, and they assume the data work from the previous section is visible rather than hidden inside "pilot."
| Phase | Typical timing | Key activities | Output |
|---|---|---|---|
| Assess | Weeks 1-4 | Audit systems, data quality, and processes; shortlist use cases | Readiness score and shortlist of use cases |
| Plan | Weeks 5-8 | Select technology, set KPIs, decide build or buy | Business case and implementation architecture |
| Pilot | Months 3-5 | Run one machine, material, and part family with agreed acceptance criteria | Measured results against the baseline |
| Scale | Months 6-12 | Roll out to more lines and integrate with MES and ERP | Standard procedures and monitoring dashboards |
| Optimize | Ongoing | Monitor drift, retrain models, and review KPIs quarterly | Sustained KPI improvement and retraining schedule |
What to decide this quarter
- Run the five phases in order. Assess readiness in weeks 1 to 4, plan in weeks 5 to 8, pilot in months 3 to 5, scale in months 6 to 12, then optimize continuously. Skipping assess is how teams buy a tool for data they cannot join.
- Stack the technology in dependency order. A governed data layer or historian for machine signals, a manufacturing execution system for production events, a maintenance system for work orders, vision or sensor platforms for inspection, a model platform for training and drift monitoring, then ERP and CRM so plant results reach revenue and service reporting. Decide build or buy only after you check data access and integration effort. The wider pattern is the same one used in digital transformation in manufacturing. Connect what you own before you add another application.
- Define the pilot as one machine, one material, and one part family. For example, a cell with frequent unplanned stops is judged against its twelve-month baseline after 90 days. Acceptance criteria, roles, and operator training are set before the work starts.
- Build the executive case on cost lines. Compare pilot savings with scrap, overtime, expedited freight, and energy spend. Prepare business cases for the top two or three initiatives, not a catalog of every use case in the first table.
- Set this quarter's decision. Run the readiness assessment, select one use case, and set a go or no-go date tied to its baseline KPI.
No finished AI strategy is required before that first conversation. You can start with a business question, an existing thesis, or a specific build. An AI Strategy Engagement can carry a current-state map, a ranked opportunity set, build-versus-buy recommendations, one lightweight proof of concept, business cases for the top two or three initiatives, and a prioritized roadmap. If you only need a fast read on readiness, an AI Quotient Assessment covers it in about 10 minutes, across data, infrastructure, workforce, culture, leadership, and compliance, before anyone argues about models.
Prometheus Agency helps growth and operations leaders turn plant data, CRM, and existing systems into AI roadmaps with a baseline, an owner, and a payback test. If you want that readiness view on your lines rather than another list of use cases, visit Prometheus Agency and start with the question your floor is already asking.