
Most advice on how to measure ROI starts in the wrong place. It begins with a formula, then skips straight to a dashboard, as if the same percentage can explain platform clicks, pipeline, and cash flow without any judgment calls. In real B2B environments, that shortcut is how good projects get approved for the wrong reasons and bad projects get defended for too long.
The right approach is stricter. Financial ROI decides whether the initiative deserves funding, attribution helps operators optimize channels and journeys, and incrementality testing is what proves whether the investment caused lift. That separation matters because 41% of marketers cannot measure ROI effectively, while only 8% use incrementality testing (Bizibl research on incrementality testing).
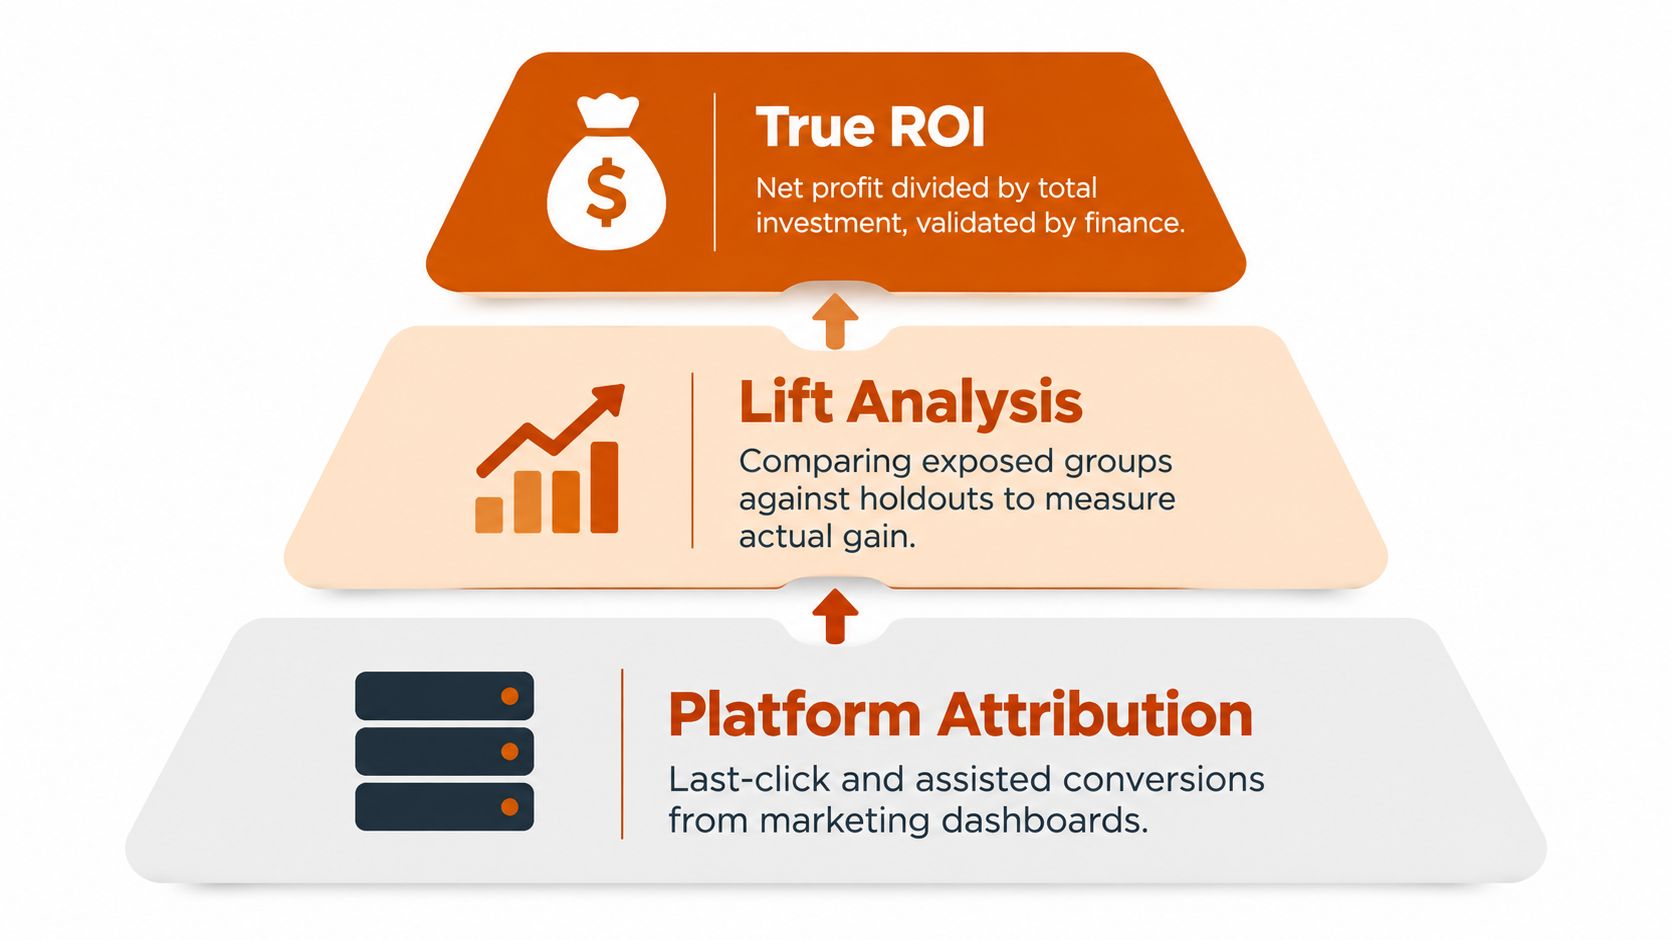
The Three Layers of Revenue Measurement
A dashboard can tell you what touched a deal. It can't tell you what would've happened without the initiative. That's the fault line that often gets ignored when ROI from CRM, paid media, or AI workflows is reported as if platform attribution were the same thing as financial proof.
Financial ROI Comes First
The investment decision needs a finance-grade answer. If a program isn't creating incremental value after all relevant costs, it doesn't matter how impressive the dashboard looks. A useful reference point is the basic ROI formula, (total benefits minus total costs) divided by total costs, multiplied by 100, because it forces the conversation onto net gain rather than vanity revenue.
Practical rule: if the numerator isn't incremental and the denominator excludes meaningful costs, the result is a sales story, not ROI.
That's why a revenue operations leader has to ask who owns the baseline, who validates the margin, and who signs off on the cost stack. Tools can make this easier, but they can't replace the judgment call. For a broader framing of stack design around this problem, see the internal guide on RevOps AI stack architecture.
Attribution is operational, not causal
Attribution is still useful, just in the right lane. It helps teams see where buyers engage, which journeys convert, and where the funnel leaks. What it doesn't do is prove that the last click, the nurture sequence, or the chatbot caused the sale.
That distinction is exactly why many teams over-credit lower-funnel activity and under-credit the work that shapes demand earlier. For practical context on the reporting side of this problem, Sprints & Sneakers on marketing ROI is a helpful companion read, especially if you're separating channel performance from investment value.
Incrementality is the causal test
Incrementality is the bridge between “associated with” and “created by.” Holdout groups, geo tests, and randomized comparisons establish a counterfactual, which is the only clean way to claim causal lift in messy B2B environments. Without that, the business case is still vulnerable to seasonality, existing demand, and pipeline already in motion.
The sharpest teams keep these three layers separate on purpose. Platform attribution guides optimization. Incrementality proves lift. Financial ROI tells finance whether to keep spending.
Establishing Baselines and Capturing Hidden Costs
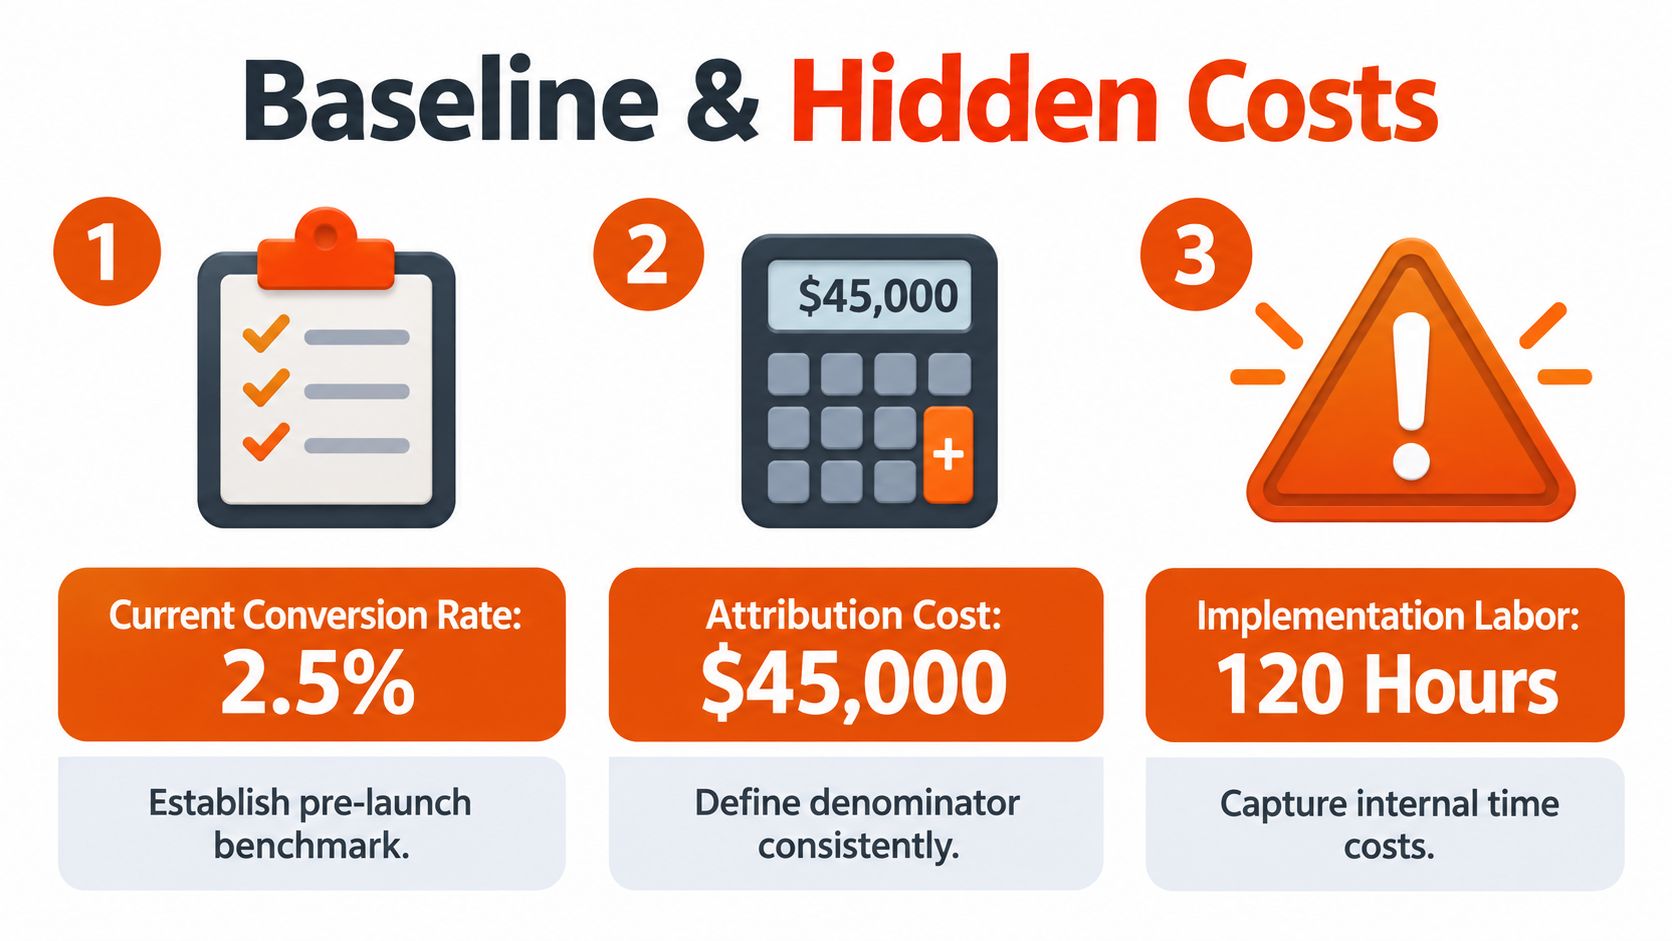
A bad baseline makes a good project look magical and a mediocre one look profitable. Before launch, document the current state in plain business terms, not platform terms. That means the existing conversion rate, cycle time, gross margin, labor cost, retention, and any risk-adjusted revenue measure that matches the decision you're making.
Start with the denominator
A credible ROI calculation requires a consistent denominator. In management accounting, that may be operating income divided by average operating assets rather than a simple comparison to purchase price. The point is not the formula itself, it's the discipline of agreeing what counts as the investment base before anyone starts celebrating.
Once that definition is locked, record the pre-launch state in a way finance can audit later. If sales cycles are long, use a comparable pre-intervention period or control group. If the initiative changes workflow rather than demand, capture baseline throughput, error rates, queue time, and the labor hours involved in the old process.
Capture the costs that usually hide in plain sight
Hidden costs are where most ROI models get inflated. Implementation labor, integration work, training, maintenance, monitoring, and workflow disruption all belong in the model if they're necessary to realize the benefit. So does the opportunity cost of delayed benefits, because a project that saves money six months later is not the same as one that saves money now.
A practical way to stay honest is to map cost categories before procurement starts. Consider the full stack of spend, then compare it to the expected benefit mechanism instead of a generic revenue target. If you want a concrete reference for AI deployment cost thinking, the internal note on AI implementation cost bands for mid-market teams is worth reviewing.
Impact opportunity: teams that document the baseline and the full cost stack before launch create a business case that survives finance review, board review, and post-launch scrutiny.
If you're building a supporting workflow around outbound or lifecycle measurement, a service like email warmup service with expert support can sit inside the broader operating plan, but only if its cost and expected contribution are part of the same denominator. That's the discipline that prevents a pilot from looking profitable while pulling down operating margin.
Applying Time and Risk to Financial Formulas
A 10% return sounds simple until you ask when the cash arrives. Two projects can have the same headline ROI and still be very different investments if one pays back quickly and the other ties up capital for years. Time changes the answer, which is why a serious ROI model has to account for discounted cash flow.
The National Institute of Standards and Technology defines net present value as the present value of positive investment cash flows minus the present value of the initial investment, and it recommends sensitivity analysis at 0%, 3%, and 7% discount rates (NIST benefit-cost guidance). That's the right frame for any initiative where benefits arrive over multiple periods, especially AI and CRM transformations that don't mature on day one.
Use annualized ROI for multi-year comparisons
Annualized ROI keeps long projects from being compared unfairly with short ones. It converts the cumulative result into a yearly rate, which makes it easier to compare a quick CRM cleanup with a broader operating model change. If you don't annualize, a long-horizon project can look better or worse than it really is.
That same timing logic also applies to payback. A project with a delayed benefit stream may still be worthwhile, but only if the NPV remains positive after discounting. Finance leaders care about both the size of the return and the path it takes to get there.
Don't approve a project on nominal upside alone
Simple ROI can hide the cost of waiting. A project that returns money later may show a nice percentage on paper, yet still destroy value if the discount rate, risk, or capital tie-up are unfavorable. That's why any evaluation should always include simple ROI, NPV, and payback period.
For practitioners who want a benchmarked explanation of marketing measurement trade-offs, The AI CMO on proving marketing is a useful outside reference, especially when teams need to align attribution language with financial reporting language.
The question isn't whether the project returns money. The question is whether it returns money fast enough, with enough confidence, to justify the capital and the operational friction.
That's the standard a CFO will apply anyway, so it's better to apply it yourself before the proposal leaves the room.
Proving Causality Through Incrementality Testing
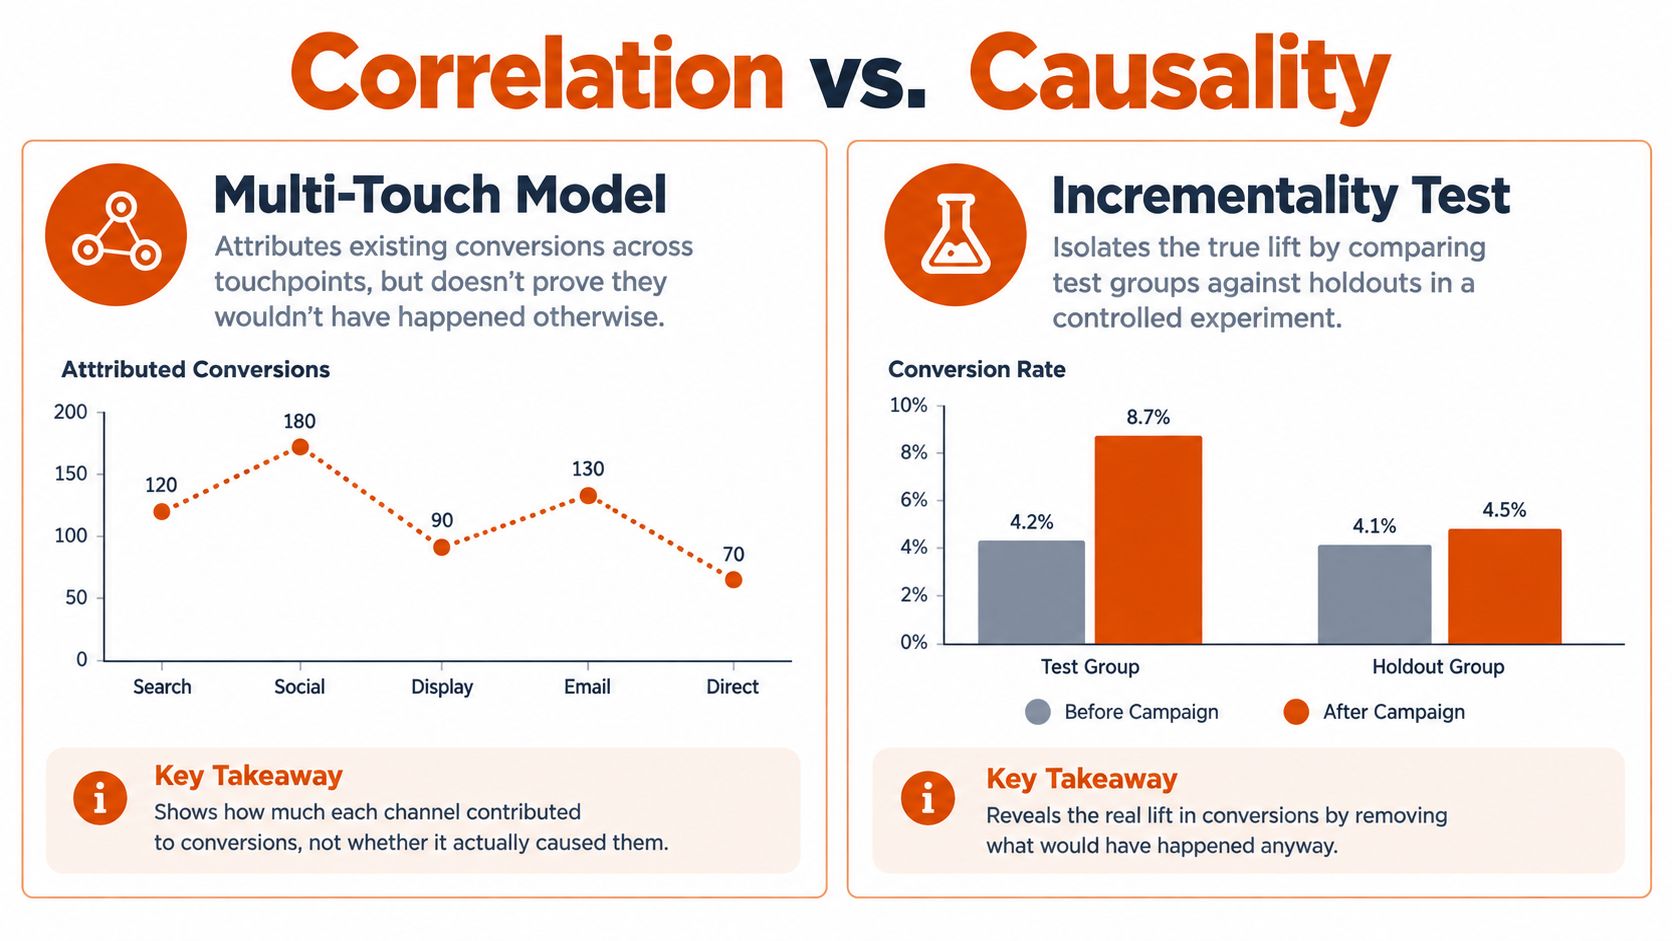
Attribution says a channel was part of the path. Incrementality says the initiative caused the outcome. Those are not interchangeable, and treating them as if they are is one of the fastest ways to overstate ROI in B2B.
Holdouts create the counterfactual
The cleanest way to prove lift is to withhold the intervention from a representative control group and compare outcomes over the same sales window. If user-level randomization isn't possible, geo or territory randomization is the next best option. The important part is that treatment and control are exposed to the same seasonality, the same market conditions, and the same measurement logic.
You then calculate incremental conversions by comparing the treatment outcome to what the control group would have produced at the same exposure level. Convert that into contribution margin, not gross revenue, because gross revenue ignores returns, retention, and sales costs.
Attribution models still have a role
Multi-touch models are useful, but for diagnosis, not proof. They help teams understand journeys, sequence, and channel interaction. They're not reliable evidence that the revenue would have disappeared without the intervention.
A published simulation found that last-touch and time-decay models overallocated credit to lower-funnel channels by approximately one-third, which means upper-funnel and lifecycle activity can be materially undervalued (JEMS simulation on attribution bias). That's why a model can be directionally helpful and still be financially misleading.
Practical rule: use attribution to optimize, use incrementality to validate, and use finance to decide.
For a more technical framework on testing and calculator design, the internal guide on AI project ROI calculator methodology fits well here. It's especially relevant when a team needs to translate experimental lift into a defensible business case.
Avoid the usual experimental traps
Incrementality work fails when the sample is too small, the groups aren't comparable, or treatment spills into control. Seasonality can also distort the result, especially in markets with quarter-end buying patterns. The fix is to pre-register the primary outcome, the test duration, the stopping rule, and the main sensitivity checks before the test starts.
If randomization isn't available, use difference-in-differences with a documented parallel-trends check. It's not as clean as a true holdout, but it's still better than claiming lift from a dashboard that only shows correlation.
Building a Defensible Reporting Cadence
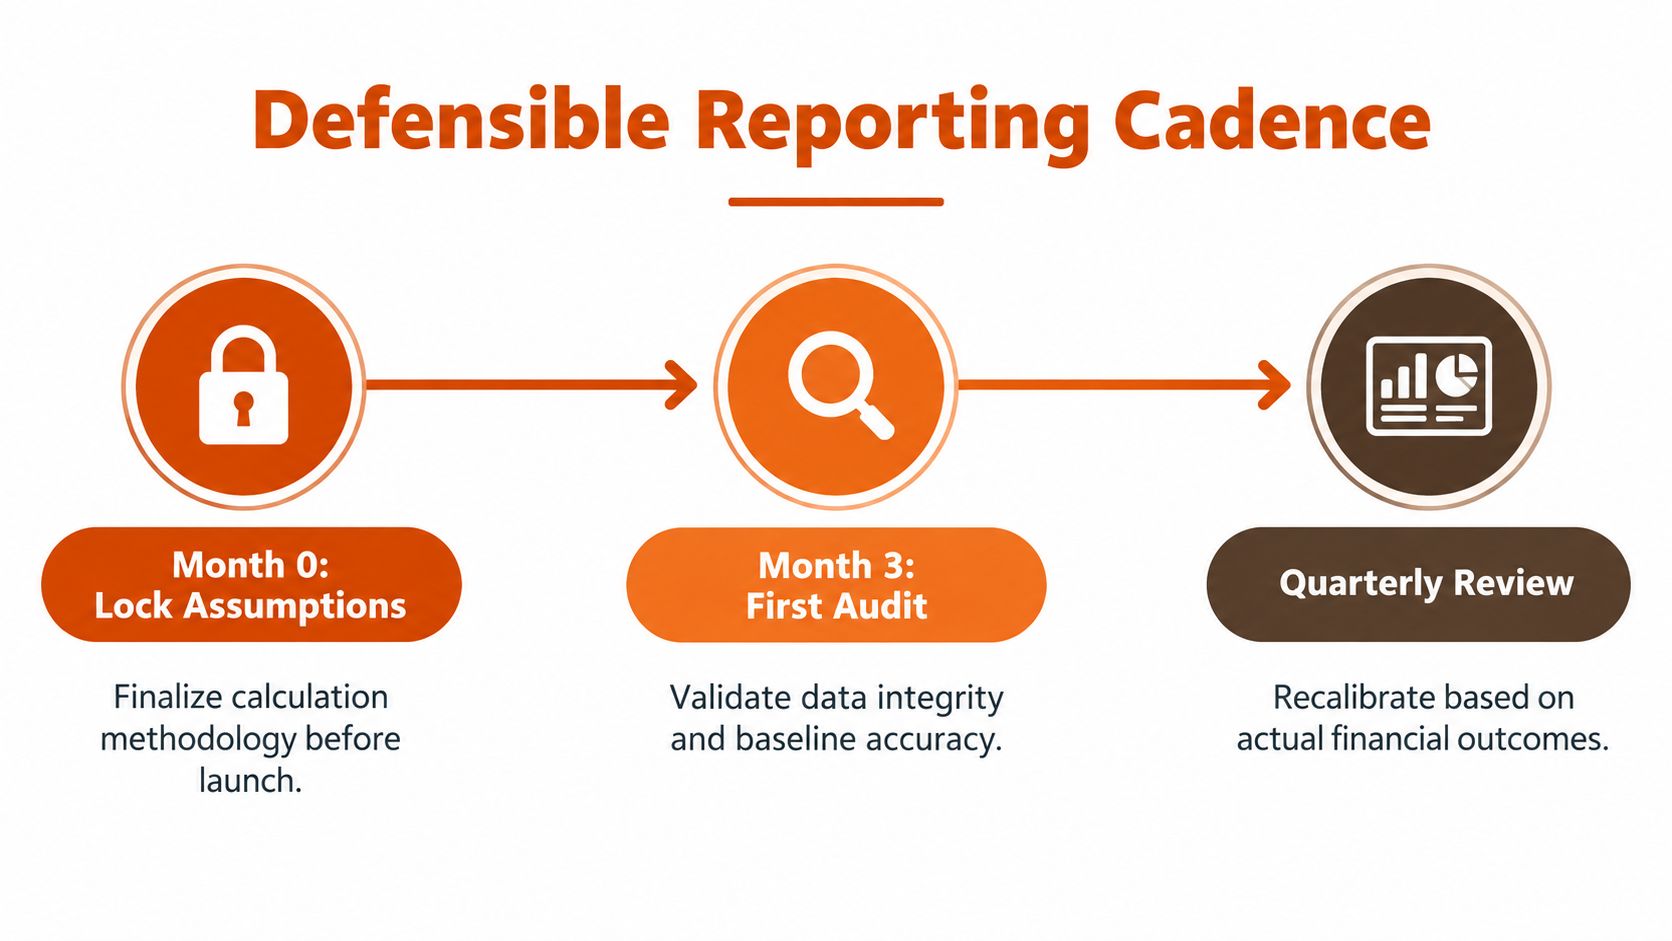
A good model dies fast if the reporting rhythm is sloppy. The teams I trust most don't wait until the end of a quarter to see whether the math holds. They lock the assumptions up front, audit the data early, and reconcile actual cash benefits on a predictable cadence.
Lock the assumptions before launch
Once the initiative is live, changing the rules weakens the result. Define the baseline period, cost categories, benefit categories, and measurement window before implementation begins. That gives everyone the same accounting language when the first results arrive.
Then establish who checks what. Finance should validate monetary assumptions, operations should verify process changes, and the revenue team should monitor leading indicators like adoption and response behavior. If those roles blur, the story gets fuzzy fast.
Reconcile reported gains to cash
A lot of teams celebrate pipeline or attributed revenue that never turns into money in the bank. That gap is where ROI reports quietly lose credibility. The monthly reconciliation has to separate realized cash benefits from activity metrics, because only one of them pays the bills.
PMI research found that organizations with a prescribed benefits-reporting process had 61% of projects meet or exceed forecast ROI, versus 44% without one (NetSuite summary of PMI research). That gap doesn't prove a formula by itself, but it does show what disciplined governance can do.
Standout point: measurement quality usually fails after launch, not before it.
A practical cadence is simple. Review assumptions early, inspect data integrity often, and compare projected versus realized value on a recurring basis. That keeps the business case honest and surfaces adoption problems before they turn into lost margin.
Key Takeaways for B2B Growth Leaders
The cleanest ROI stories are rarely the ones with the flashiest dashboards. They're the ones where the leader can explain the baseline, the full cost stack, the causal test, and the cash outcome without changing definitions halfway through the conversation. In a complex tech stack, that discipline matters more than the elegance of the chart.
A simple example makes the point. A CRM cleanup may show stronger attribution because the pipeline is easier to track, while an AI workflow may show attractive productivity gains that don't survive governance review if the team ignores adoption, rework, and monitoring costs. Both can be valuable, but only if the measurement model captures what actually changed in the business.
The mental model to keep is straightforward:
- Financial ROI decides whether the initiative deserves capital.
- Attribution helps operators optimize channels and workflows.
- Incrementality proves the initiative created the lift.
- NPV and payback keep timing and risk in the frame.
- Governed reporting keeps the result credible after launch.
If you're leading AI, CRM, or go-to-market change, don't let platform metrics speak for the business. Define the denominator, isolate the causal lift where you can, and report the cash effect in a way finance can trust. That's how to measure ROI without fooling yourself or the board.
Prometheus Agency helps growth leaders turn AI, CRM, and reporting systems into measurable revenue programs, with baselines, operating metrics, and executive dashboards built around actual business outcomes. If you're trying to prove value from a new initiative and want a sharper measurement model, visit Prometheus Agency to see how its team approaches strategy, implementation, and reporting.