Chasing a high lead count is a trap. The best lead generation key performance indicators don't just tally up raw leads; they measure the actions that truly signal the health of your business and, more importantly, predict future revenue. A smart measurement system is what bridges the gap between your marketing efforts and real sales outcomes.
Why Most B2B Lead Generation Metrics Are Misleading
It’s easy to get excited about a month with record-breaking lead numbers. But that excitement often hides a much bigger problem. When you focus only on lead volume, you can burn out your sales team and waste your marketing budget chasing ghosts who will never buy. It creates the illusion of momentum while completely ignoring the metrics that actually matter.
A high lead count might feel like you’re hitting the accelerator, but the right KPIs make sure you're actually pointed toward your destination: revenue.
Real growth happens when you shift your focus from quantity to quality. This isn't just a small tweak. It means moving beyond simple headcounts and embracing a more sophisticated set of lead generation KPIs that measure efficiency, lead quality, and bottom-line financial impact.
Moving From Vanity Metrics to Revenue Drivers
Vanity metrics, like total leads or social media likes, look great in a report but offer almost no real insight into the health of your business. They feel good but can't answer the tough questions leaders need to be asking.
Practical Example: Let's say your marketing team pulls in 1,000 leads in a single month—a new company record. But when sales digs in, they only qualify 20 of them as legitimate opportunities. Out of those, just one becomes a customer. The vanity metric (1,000 leads) completely masks the fact that your lead-to-customer conversion rate is a dismal 0.1%. This is a massive red flag signaling a disconnect between what marketing is doing and what sales actually needs.
If you want to build a predictable growth engine, you have to prioritize metrics that tell the whole story, from the first touchpoint to the final sale. This is how you separate busy work from high-impact results.
Key Takeaways
- Lead volume alone is misleading. It rarely reflects lead quality or the actual likelihood of conversion, creating a false sense of security.
- Strategic KPIs connect marketing to revenue. Metrics like Customer Acquisition Cost (CAC) and conversion rates paint a clear picture of profitability and efficiency.
- Quality over quantity prevents waste. Focusing on qualified leads means your sales and marketing resources are invested in opportunities with the highest chance of paying off.
Impact Opportunity
When you master these concepts, you can start building a predictable growth engine. By focusing on the right lead generation key performance indicators, you can justify your marketing spend, get your teams aligned around shared revenue goals, and make data-driven decisions that fuel sustainable, long-term growth.
Mastering Your Core Funnel Health Metrics
If you want to get a real handle on your growth potential, you need to master the two most fundamental lead generation KPIs: Lead Volume and Conversion Rate. Think of them as the vital signs for your entire sales funnel.
Lead Volume is the raw fuel you're putting into the engine. Conversion Rate tells you how efficiently that engine is turning fuel into forward momentum.
Looking at either one alone is a great way to fool yourself. A huge spike in leads might feel like a win, but if none of them are turning into customers, it’s just expensive noise. On the flip side, a fantastic conversion rate doesn’t mean much if you’re only closing a handful of deals. The magic happens when you look at them together.
This concept map breaks down how to move past simple vanity metrics and focus on the KPIs that actually drive strategic decisions and, ultimately, revenue.
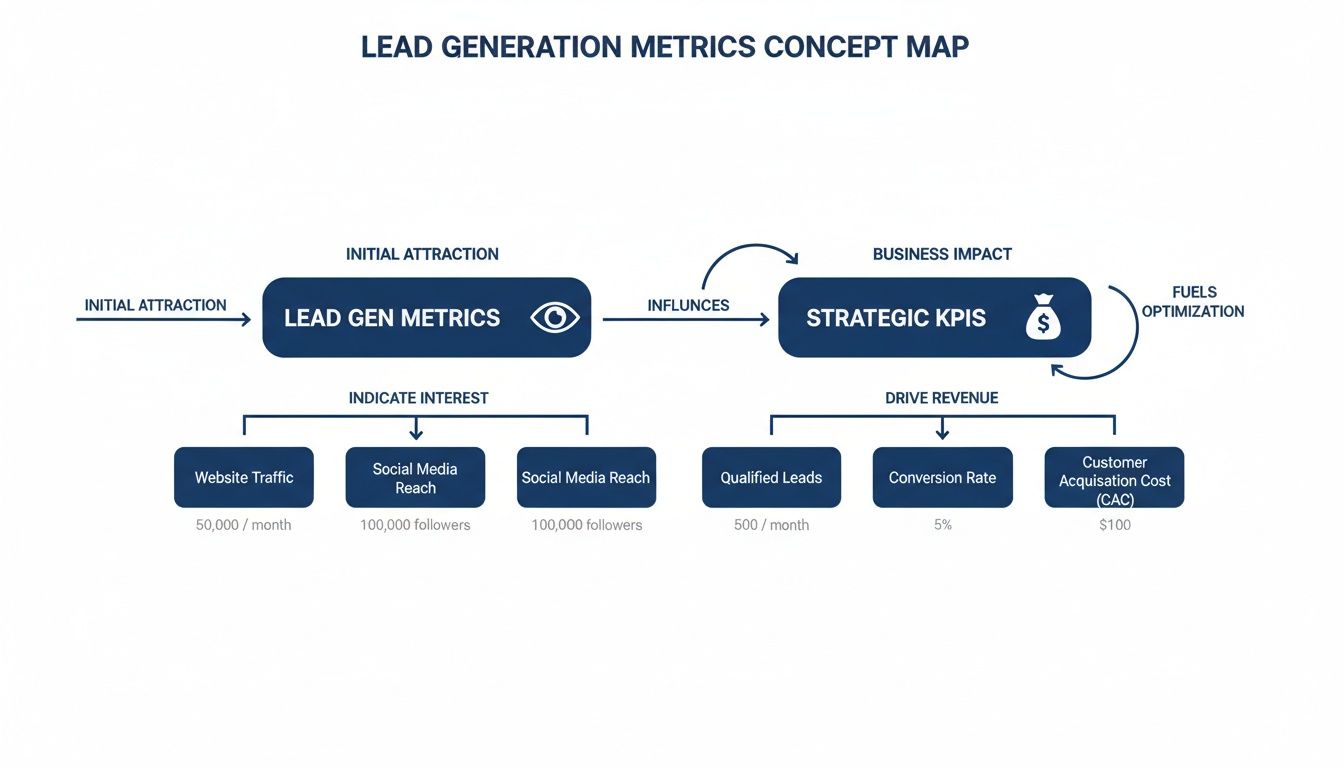
As you can see, the goal is to connect every metric back to what matters most: efficient, predictable growth.
Diagnosing Your Funnel's Health
The interplay between lead volume and conversion rate tells a story. It lets you pinpoint exactly where the problem is—whether you have a top-of-funnel awareness issue or a mid-funnel qualification breakdown.
- High Volume, Low Conversion: This is a classic sign of a lead quality problem. Your marketing is casting a wide net and getting attention, but you're attracting the wrong fish. The solution isn't more leads; it's better leads.
- Low Volume, High Conversion: This tells you your messaging and sales process are hitting the mark, but not enough people are seeing it. Your core challenge is to scale up your marketing and get your killer offer in front of a bigger, but still relevant, audience.
- Low Volume, Low Conversion: This points to some foundational cracks in your go-to-market strategy. You likely need to rethink both who you're targeting and what you're saying to them.
- High Volume, High Conversion: This is the sweet spot. You've built a healthy, scalable growth engine. The game now is to maintain this balance while carefully exploring new channels for expansion.
The matrix below can help you quickly diagnose your situation and decide on the next steps. It’s a simple but powerful tool for any marketing or sales leader.
Lead Volume vs. Conversion Rate Diagnostic Matrix
| Scenario | Potential Diagnosis | Recommended Action |
|---|---|---|
| High Volume, Low Conversion | Poor lead quality or targeting mismatch. | Refine audience targeting, tighten MQL criteria, and improve ad creative/messaging. |
| Low Volume, High Conversion | Insufficient market reach or awareness. | Increase marketing spend on proven channels, explore new top-of-funnel tactics (content, PR). |
| Low Volume, Low Conversion | Fundamental strategy/messaging issues. | Conduct market research, redefine ideal customer profile (ICP), and A/B test core value propositions. |
| High Volume, High Conversion | Healthy and scalable growth model. | Maintain current strategy, optimize for efficiency, and strategically test new expansion channels. |
By using this framework, you move from guessing to diagnosing, allowing you to apply the right fix instead of just trying anything and everything.
Understanding Conversion Rate Benchmarks
Your conversion rate is a critical KPI, especially in B2B, but "good" can be a moving target. As a general rule of thumb, a solid lead-to-customer conversion rate hovers between 10-15%.
If you're dipping below 5%, it’s a strong signal that something is off with either lead quality or your sales follow-up. On the other hand, anything over 20% is exceptional and suggests you have a highly effective and dialed-in process.
Balancing lead volume with conversion rate is about stopping the waste. You identify the channels bleeding money on low-quality traffic and reallocate that budget to the ones that consistently deliver leads ready to buy.
Key Takeaways
- Analyze in Tandem: Never look at lead volume or conversion rate in a vacuum. The relationship between them is where the real story is.
- Quality Over Quantity: A flood of new leads is worthless if it tanks your conversion rate. Always prioritize the channels that bring in leads who actually convert.
- Pinpoint the Problem: Use these two metrics to figure out if you need to fix your marketing reach (top of funnel) or your qualification and sales process (mid-funnel).
Impact Opportunity
When you get this balance right, the impact ripples across the business. You build a more predictable pipeline, your marketing ROI skyrockets, and your sales and marketing teams finally start rowing in the same direction—focused not just on leads, but on revenue. To get a deeper look at tying these metrics to real business outcomes, check out our guide on reporting and analytics.
For those ready to take their funnel optimization to the next level, the definitive guide on AI powered sales intelligence is a must-read.
From Lead Volume to Lead Quality: MQLs and SQLs
If you're only tracking the sheer number of leads coming in, you're flying blind. To get anywhere, you need to move past volume and start talking about quality. This means getting marketing and sales to speak the same language about what a "good" lead actually is.
This is where two of the most important lead generation key performance indicators come into play: the Marketing Qualified Lead (MQL) and the Sales Qualified Lead (SQL). These aren't just buzzy acronyms. They're the very foundation of an efficient and predictable revenue engine.
Think of it like a funnel, but for quality, not just quantity. You pour a ton of raw leads in the top. The first filter catches the tire-kickers and separates genuinely interested people from the general noise. What comes out is your pool of MQLs.
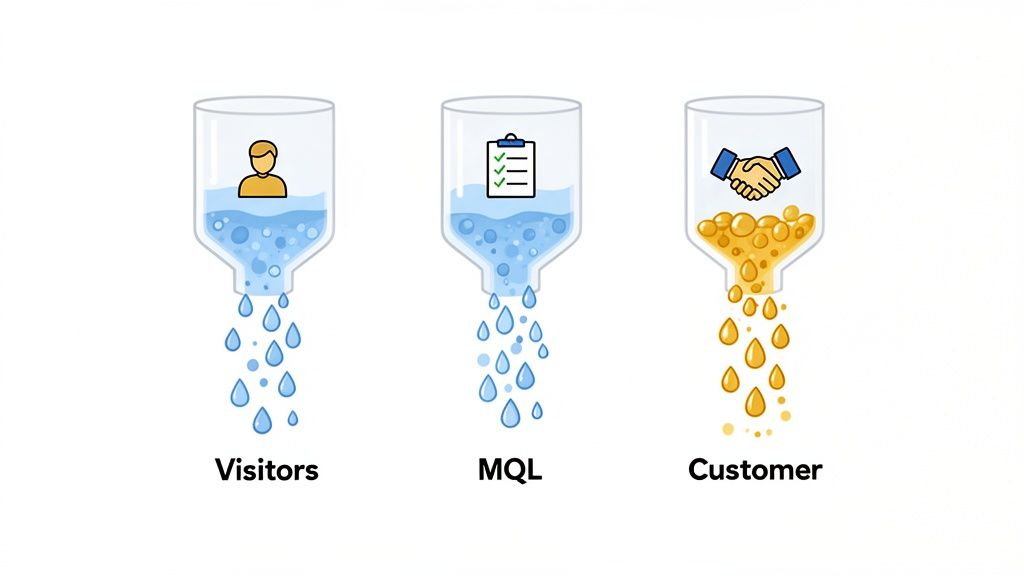
This initial sorting process is absolutely essential. It prevents your sales team from burning out chasing dead ends and lets them focus their energy where it'll actually make a difference.
From Marketing Interest to Sales Readiness
The jump from a raw lead to an MQL is your first real quality check. An MQL is someone who's shown legitimate interest and fits your ideal customer profile, but they probably aren't ready to pull out their credit card just yet. Marketing has "qualified" them as being worth the effort to nurture.
From there, those MQLs go through a much finer filter. This is the handoff to sales, who look at them with a more critical eye. They're asking: does this person have a real, near-term need? Do they have the authority to buy? The leads that pass this second, more rigorous test become SQLs—the prospects who are truly ready for a sales conversation.
An MQL says, "This person looks like a good fit and is showing interest." An SQL says, "This person is a good fit, showing interest, and is ready to talk about buying." This distinction is the bedrock of a scalable sales process.
Building a Universal Lead Score
To stop this from being a subjective guessing game, you need a Lead Score. It’s a simple points-based system that assigns value to leads based on who they are (demographics) and what they do (their behavior). It takes the guesswork out and creates a clear, universal definition of what "qualified" means for your business.
- Firmographic Data: This is the "who." Think company size, industry, job title, and location. This data tells you if the lead fits your Ideal Customer Profile (ICP).
- Behavioral Data: This is the "what." It tracks engagement like which pages they visited, what content they downloaded, or if they attended a webinar. These actions signal interest and intent.
Practical Example: A director of operations at a 500-person manufacturing company who visits your pricing page and requests a demo would receive a high lead score. On the flip side, a student who downloads a single whitepaper from a university IP address gets a low score. Your sales team only gets involved once a lead hits a certain score threshold, ensuring they're only talking to the hottest prospects. This is also where smart automation can be a game-changer. For more on that, check out our guide to AI-powered lead generation.
Key Takeaways for Lead Qualification
Getting this MQL-to-SQL system right boils down to alignment and clear definitions. Here’s what you need to nail down:
- Define MQL Criteria: Marketing and sales have to sit down and agree on the exact mix of demographic and behavioral signals that make someone an MQL.
- Define SQL Criteria: Sales needs to clearly spell out what else is needed for them to accept a lead. This often comes down to the classic BANT framework: Budget, Authority, Need, and Timeline.
- Establish a Service-Level Agreement (SLA): Put it in writing. Create a formal agreement that defines who does what, including how many MQLs marketing will deliver and how fast sales will follow up on them.
This structured approach transforms your funnel from a leaky pipe into a high-pressure system that moves prospects toward a sale with purpose. It ensures marketing spends its budget attracting the right people and your sales team spends their valuable time only on leads with a real chance of closing. The ripple effect on your entire revenue operation is massive, creating a more predictable and efficient path to growth.
Connecting Marketing Spend to Business Profitability
Funnel metrics and lead quality are crucial, but that's not the language spoken in the boardroom. When you’re talking to executives and investors, the conversation shifts from marketing activity to financial returns. To truly prove your worth, you have to translate lead generation efforts into the cold, hard numbers that define business health.
This is where you graduate from operational lead generation key performance indicators to metrics that measure profitability. Getting a handle on these financial KPIs is how you justify bigger budgets, win arguments for strategic investments, and finally prove that marketing is a profit center, not a cost center. The two most important KPIs in this arena are Customer Acquisition Cost (CAC) and Customer Lifetime Value (LTV).
Calculating Your Customer Acquisition Cost
Your Customer Acquisition Cost (CAC) is the total price you pay to win a single new customer. It’s a brutally honest metric. It forces you to bundle every single sales and marketing expense—from ad spend and salaries to software licenses—and divide it all by the number of new customers you signed in a given period.
The formula itself is refreshingly simple:
CAC = (Total Sales & Marketing Costs) / (Number of New Customers Acquired)
Practical Example: If you drop $50,000 on sales and marketing in one quarter and land 50 new customers, your CAC is $1,000. That number alone tells you what it costs to grow, but it's only half the story. Its real power comes when you stack it up against what that customer is actually worth to the business.
Uncovering Customer Lifetime Value
Customer Lifetime Value (LTV) tells you the total revenue you can expect to earn from a customer over their entire relationship with you. It’s a long-term view that moves beyond a single purchase to measure the sustained profitability of your customer base. A high LTV is a great sign—it points to strong product-market fit, happy customers, and a healthy, recurring revenue model.
The simplest way to figure out LTV is:
LTV = (Average Revenue Per Account) x (Customer Lifetime)
Practical Example: If your average customer pays you $500 a month and sticks around for 36 months, their LTV is a cool $18,000. This metric finally answers the big question: what is a customer really worth to us?
The Ultimate Health Metric: The LTV to CAC Ratio
CAC is what you spend. LTV is what you get. Neither tells the whole story on its own. The magic happens when you bring them together in the LTV:CAC ratio. This single number is arguably the most powerful indicator of your business model's health and scalability. It tells you exactly how much value you’re creating for every dollar you spend on acquisition.
Let’s look at a few scenarios:
- 1:1 Ratio: This is bad. For every dollar you spend, you get one dollar back. You're just treading water, and eventually, you're going to sink.
- 3:1 Ratio: This is the gold standard. A 3:1 ratio is widely seen as the baseline for a healthy, sustainable business. You’re generating three dollars in value for every dollar you invest.
- 5:1 Ratio: This is a green light to hit the gas. Your acquisition engine is incredibly efficient. Every new dollar you pump into marketing will likely deliver a strong, predictable return.
Mastering the LTV:CAC ratio is how you steer the ship. A strong ratio is the best evidence you can bring to the table to prove your marketing and sales engine isn't just busy—it's profitable. It also helps you decide how much you can afford to spend on different channels. To get a better handle on that, it's worth exploring strategies for full-funnel paid media campaigns.
Key Takeaways
- Speak the Right Language: CAC and LTV turn marketing jargon into financial metrics that leadership actually cares about.
- Profitability is Key: A low CAC is useless if the customer leaves tomorrow. A high LTV doesn't help if it costs a fortune to get them. The ratio is everything.
- A Healthy Ratio Signals a Green Light: An LTV:CAC ratio of 3:1 or higher is the ultimate proof that your business model works and is ready for more investment.
Impact Opportunity
Once you get comfortable with these financial KPIs, you stop defending your budget and start making data-backed arguments to grow it. When you can draw a direct, profitable line from marketing spend to customer value, you earn a strategic seat at the table. You become an architect of the company’s growth.
Gauging The Speed And Efficiency Of Your Growth Engine
So far, we've connected marketing to lead quality and, ultimately, to the bottom line. But there's another crucial dimension we need to talk about: speed. It isn't just about what leads you get or what they cost. It’s about how fast you’re getting them. The velocity of your growth engine is one of the most powerful predictors of where your business is heading.
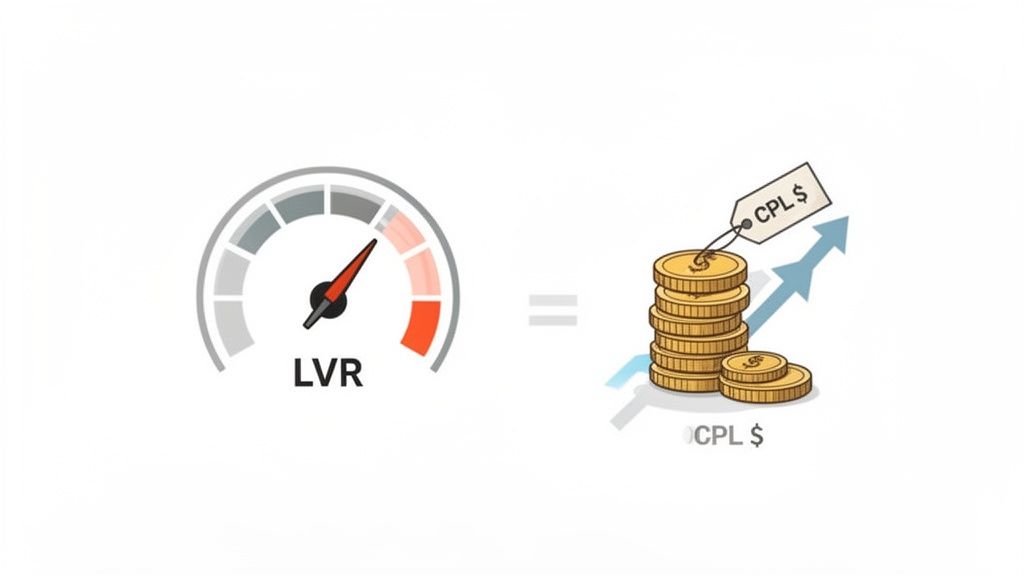
To get a handle on this, we'll look at two specific KPIs. One measures tactical efficiency—how well you're spending your money—and the other tracks strategic momentum. Let's dive into Cost Per Lead (CPL) and Lead Velocity Rate (LVR).
Cost Per Lead: Your Tactical Efficiency Gauge
Cost Per Lead (CPL) is a no-nonsense metric. It tells you exactly how much you're spending to acquire a single new lead. Think of it as a real-time efficiency score for your marketing campaigns, showing you which channels are bringing in leads at a price that actually makes sense for your business.
The formula couldn't be simpler:
CPL = Total Marketing Spend / Total New Leads Generated
Practical Example: Let's say you spend $10,000 on a campaign with LinkedIn and it brings in 200 leads. Your CPL is $50. This number is your tactical lever. When you see a high CPL on a campaign, you know it's time to dive in and optimize your targeting, creative, or messaging to bring those costs back in line. It’s the metric that guides smart, short-term budget decisions.
CPL isn’t just a marketing number; it's a financial efficiency metric that directly impacts your marketing ROI and budget. The results of optimizing it can be massive. For instance, one community bank managed to slash its CPL by 83% by restructuring its paid media strategy, all while generating $5.9M in new deposits. This shows how getting systematic about your lead generation mechanics can directly slash customer acquisition costs. You can find more lead generation measurement strategies on triggmine.io.
Lead Velocity Rate: Your Growth Accelerator
While CPL helps you manage the day-to-day costs, Lead Velocity Rate (LVR) tells you where your business is actually going. It doesn't just count your leads; it measures the growth of your qualified leads month-over-month. This makes it an incredibly powerful predictor of future revenue.
Here’s an analogy: if your total qualified leads is your car's speed, LVR is its acceleration. A car cruising at a steady 60 mph is doing fine, but a car accelerating from 40 to 60 mph is showing real momentum. LVR is what captures that forward thrust.
Here’s the formula:
LVR = [(Number of Qualified Leads This Month - Number of Qualified Leads Last Month) / Number of Qualified Leads Last Month] x 100
Practical Example: If you generated 115 qualified leads this month and 100 last month, your LVR is 15%. A company that brings in a steady 100 leads every month might seem stable, but its 0% LVR is a sign of stagnation. Worse, a declining LVR, even if you're still hitting your lead volume target, is an early warning sign of a revenue shortfall on the horizon.
Key Takeaways
- Use CPL for Short-Term Optimization. Keep a close eye on CPL at the campaign and channel level to control your marketing spend and fine-tune your tactics.
- Use LVR for Long-Term Prediction. Track your LVR every month to forecast your pipeline's growth and get a reliable picture of future revenue.
- They Work Together. A low CPL proves you're efficient. A high LVR proves you're growing. You need both to build a growth engine that's not just sustainable but scalable.
Impact Opportunity
There’s a reason investors and board members love LVR: it’s a clear, forward-looking indicator of growth. While your marketing team might be obsessed with CPL, leaders who are building a case for their company’s trajectory need to master LVR. It's the metric that proves your pipeline isn’t just healthy—it’s actively expanding. That makes it an absolutely essential KPI for any executive responsible for driving growth.
Putting Your Lead Generation KPIs into Action
Knowing your lead generation key performance indicators is one thing. Actually turning that knowledge into a system that fuels growth? That's a whole different ballgame. Knowledge without execution is just trivia. This is where you build the operational muscle to turn raw data into smarter decisions, bigger budgets, and predictable revenue.
The real goal here is to create a closed-loop system of measurement and optimization. You don't just glance at numbers on a dashboard. You use them to drive specific, targeted actions that make your marketing better every single month. This approach turns disconnected campaigns into a cohesive, intelligent growth engine that gets smarter over time.
A Five-Step Playbook for Implementation
Building a data-driven culture isn't about buying complex software or hiring a team of data scientists. It starts with a simple, clear process—a rhythm of review and action that everyone on the team can actually follow.
- Define Your Primary Goal: Start with the end in mind. Are you trying to slash your Customer Acquisition Cost (CAC) by 15% this quarter? Or maybe you need to fix a leaky funnel and boost your MQL-to-SQL conversion rate. Pick one or two big goals to rally around.
- Set Up Foundational Tracking: Make sure your tools are talking to each other. This means your CRM and analytics platforms are actually capturing the data you need, your ad platform conversion goals are configured properly, and you can trace a lead’s entire journey from their first click to a closed deal.
- Establish Your Baselines: You can't improve what you don't measure. For the first month, just gather data. What’s your current Cost Per Lead (CPL)? What’s your Lead Velocity Rate (LVR)? This isn't about judgment; it's about establishing a starting line.
- Schedule a Review Cadence: Put a recurring "KPI Review" on the calendar and treat it like gold. A monthly check-in works well for big-picture metrics like LTV:CAC, while a quick weekly huddle is better for tactical KPIs like CPL on active campaigns.
- Turn Insights into Action Items: This is the most critical step. Every number you review must lead to a question, and every question should generate a concrete action item assigned to a specific person with a clear deadline. No exceptions.
Designing a Practical KPI Review Meeting
Your monthly KPI review needs to be a problem-solving session, not a reporting recital. The focus shouldn't be on the numbers themselves, but on the story the numbers are telling.
Your dashboard isn't there to report the news; it's there to make the news. Each chart and metric should provoke a question: "What should we do differently next month based on this data?"
Practical Example: During a review, you see your MQL-to-SQL conversion rate tanked by 20%. Instead of just shrugging and moving on, the team digs in to figure out why. The action item? The heads of marketing and sales will sit down and review the last 50 MQLs together to see if lead quality has genuinely nose-dived or if the sales follow-up process is broken.
Key Takeaways
- Start with a Goal: Define what you want to improve before you start tracking. This focuses your efforts on what truly matters.
- Establish a Rhythm: Create a consistent schedule for reviewing KPIs (weekly, monthly, quarterly) to build a data-driven habit.
- Prioritize Action: The goal of measurement isn't reporting; it's action. Every insight must lead to a specific, assigned task.
Impact Opportunity
This structured approach is how you make data work for you. By creating this feedback loop—measure, analyze, act, repeat—you build a system that self-corrects and improves with every cycle. This is what transforms your lead generation from a guessing game into a predictable, scalable process that consistently drives business growth. You stop reacting to fires and start anticipating them, making strategic adjustments before they ever hit your bottom line.
Your Questions, Answered
Navigating the world of lead generation key performance indicators can feel a bit like flying a plane in the fog. Let's clear the air. Here are a few direct answers to the questions I hear most often from B2B leaders trying to build a solid measurement strategy.
How Often Should We Be Looking At Our KPIs?
There’s no one-size-fits-all answer here. The right review cadence depends entirely on what the metric is telling you. You wouldn't check your quarterly revenue daily, and you shouldn't check your daily ad spend quarterly.
Weekly Check-in: Tactical, fast-moving metrics belong here. Think Cost Per Lead (CPL) and website conversion rates on a specific campaign you just launched. A weekly look lets you steer the ship and make quick adjustments.
Monthly Review: This is for your more strategic metrics. Your MQL-to-SQL conversion rate and Lead Velocity Rate (LVR) fit perfectly. A month gives you enough data to spot real trends without getting jumpy over a few slow days.
Quarterly Huddle: Big-picture financial KPIs like Customer Acquisition Cost (CAC) and the LTV:CAC ratio are best reviewed quarterly. This aligns your marketing performance with the company's financial planning and board-level conversations.
The goal is to find a rhythm. You want to be responsive enough to fix what's broken but patient enough to avoid reacting to every minor blip on the radar.
What's The Single Most Important KPI For A B2B SaaS Company?
If I had to pick just one, it's the LTV:CAC ratio. Hands down.
While other metrics are like gauges for individual parts of your growth engine, the LTV:CAC ratio tells you if the entire machine is actually working—and if it's profitable.
A healthy LTV:CAC ratio, ideally 3:1 or better, is the ultimate proof that your business model is sound. It confirms that your marketing is efficient, your sales team is effective, and your product delivers enough value to keep customers around. It’s the metric that tells you whether to hit the accelerator or tap the brakes.
We Aren't Tracking Anything Right Now. Where Do We Even Start?
If you're starting from a blank slate, the key is to not get overwhelmed. You don't need a massive, complicated dashboard on day one. Just start with the basics and build from there.
Practical Example: Your first job is to get a CRM in place and make it your single source of truth. Once that's done, focus on just three foundational metrics to get the ball rolling:
- Total Leads Generated each month.
- Your overall Website-to-Lead Conversion Rate.
- The Cost Per Lead (CPL) from your primary channels.
Nail these down first. Once you're tracking them consistently, your next step is to sit down with sales and hammer out a crystal-clear definition of an MQL and an SQL. This phased approach lets you build a powerful measurement framework without trying to boil the ocean.
At Prometheus Agency, we help B2B leaders turn data into predictable revenue. Our AI enablement and CRM optimization services build the durable growth systems you need to scale with confidence. Schedule your complimentary Growth Audit and AI strategy session.