Measuring marketing ROI is about more than just a simple formula. Sure, you can plug numbers into (Revenue - Marketing Cost) / Marketing Cost, but that doesn't give you the whole story. A truly accurate picture only emerges when you define what success actually looks like and get a firm handle on your core unit economics. This foundational work is what separates guessing from knowing.
Key Takeaways
- Define Clear Goals: Vague objectives like "increase awareness" are impossible to measure. Tie every marketing activity to specific, tangible outcomes like generating a set number of qualified leads with a target value.
- Master Unit Economics: Before anything else, calculate your Customer Acquisition Cost (CAC) and Customer Lifetime Value (LTV). A healthy business model requires an LTV at least three times greater than its CAC.
- Choose the Right Attribution: Simple models like last-touch attribution give a dangerously incomplete picture. Use multi-touch models (like U-Shaped or W-Shaped) to accurately credit every touchpoint in a complex B2B buyer journey.
- use Technology: Manual data analysis is slow and prone to error. Use integrated analytics and AI-powered platforms to automate data aggregation, uncover hidden patterns, and optimize budget allocation in real-time.
- Build Actionable Dashboards: Data is useless if it doesn't drive decisions. Create tailored dashboards for different audiences (executives vs. marketing team) and establish a regular cadence for reviewing insights and taking action.
Setting the Stage for Accurate ROI Measurement
Before you touch a single dashboard or pick an attribution model, you have to build a solid foundation. Without it, your ROI calculations are built on sand, leading to shaky conclusions and bad budget decisions. This isn't about complex math; it's about strategic alignment. Think of it as the pre-flight check that ensures every other step is accurate, relevant, and trusted by your entire organization.
From Vague Goals to Tangible Outcomes
So many teams get stuck chasing vanity metrics because their goals are just too fuzzy. "Increase brand awareness" or "drive more traffic" are impossible to measure in terms of financial return. The first real step is translating those ambitions into specific, measurable outcomes tied directly to revenue.
Practical Example
Instead of just aiming for "more leads," a much sharper goal is to "generate 50 marketing-qualified leads (MQLs) from our Q3 webinar series with an average value of $5,000 each." Suddenly, you've connected a marketing activity to a real dollar figure.
Here’s how you can transform vague goals into ones you can actually measure:
- Vague: Improve content marketing.
- Measurable: Increase organic demo requests from blog content by 20% over the next six months.
- Vague: Boost social media engagement.
- Measurable: Generate 100 new trial sign-ups attributed to our LinkedIn ad campaign, targeting a Cost Per Acquisition of $150.
Understanding Your Core Financial Metrics
Once your goals are crystal clear, you need to zero in on the two metrics that underpin every B2B marketing ROI calculation: Customer Acquisition Cost (CAC) and Customer Lifetime Value (LTV).
- Customer Acquisition Cost (CAC): This is the all-in cost to land a new customer. We're talking ad spend, salaries, software subscriptions, overhead—everything. Knowing your CAC is non-negotiable if you want to understand profitability.
- Customer Lifetime Value (LTV): This is the total revenue you can reasonably expect from a single customer over the entire course of your relationship. A high LTV means your marketing efforts are bringing in customers who stick around and deliver long-term value.
A healthy business model typically requires an LTV to be at least three times greater than the CAC. If you spend $1,000 to acquire a customer (CAC) who only generates $1,500 in total revenue (LTV), your marketing engine simply isn't sustainable. Aiming for a 3:1 ratio or higher is what ensures profitability and gives you the fuel for scalable growth.
This initial planning sets the stage for everything that follows. The principles of defining costs and desired returns apply across all platforms, whether you're running Google Ads or figuring out how to maximize your Amazon advertising ROI.
As the market evolves, the most successful firms are combining these standardized financial formulas with modern attribution, often using benchmarks like a 5:1 return ratio to guide their B2B expectations.
Calculating ROI Across Different Marketing Channels
Trying to apply one generic ROI formula to your entire marketing mix is a classic mistake. It's like using a hammer to turn a screw—you might get some results, but you're not using the right tool for the job. Not every channel pays off on the same timeline, and forcing them into the same box will give you a skewed picture of what’s actually working.
A smarter approach means respecting these differences. It’s what keeps you from axing a slow-burn strategy like SEO just because it can’t match the instant gratification of an email campaign.
This infographic breaks down the core concepts—Goals, CAC, and LTV—that you need to get right before you can even begin to calculate ROI accurately.
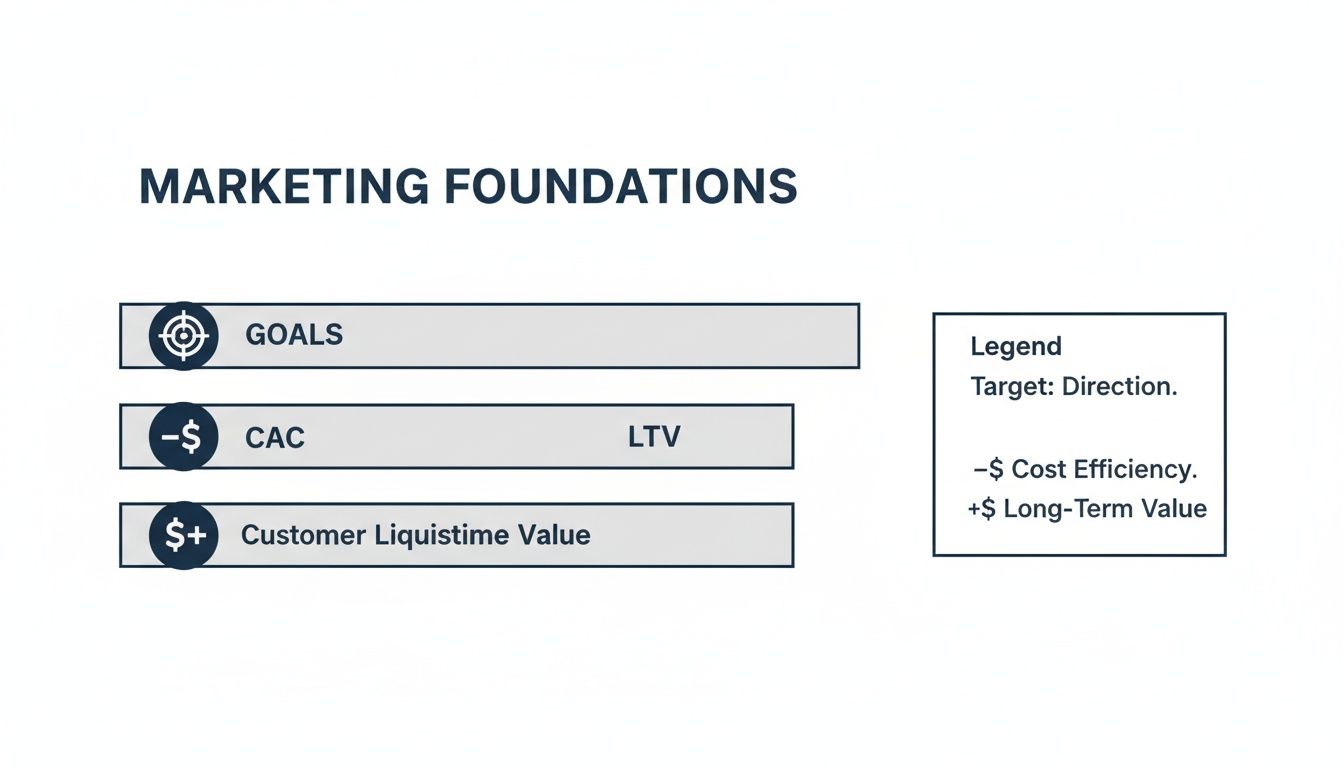
As you can see, it separates the cost of getting a customer (CAC) from the profit they bring in over time (LTV). Understanding both is non-negotiable for building a sustainable growth engine.
Measuring Short-Term, High-Impact Channels
Some channels are built for speed. Think email marketing and paid search. They’re designed for direct response, which makes their ROI relatively simple to track.
Email Marketing: This one’s a consistent heavy-hitter, often delivering some of the highest returns out there. Its direct nature makes it easy to follow the money from the moment you hit "send."
- Formula: (Revenue from Email Campaign - Campaign Cost) / Campaign Cost
- Costs to Include: Don't just count ad spend. Factor in your ESP fees, any creative asset costs, and the portion of your team's salary dedicated to the campaign.
- Practical Example: Let's say a B2B SaaS company spends $1,000 on an email campaign announcing a new feature. That campaign directly leads to $15,000 in customer upgrades. The ROI is ($15,000 - $1,000) / $1,000, which comes out to a massive 1,400%.
Paid Media (PPC): Platforms like Google Ads give you instant feedback on spend and conversions. That’s why Return on Ad Spend (ROAS) is the go-to metric. But ROAS is just a starting point. A true ROI calculation needs to account for all the other costs involved. Our agency lives and breathes this stuff, building campaigns that deliver transparent and powerful paid media results.
- ROAS Formula: Campaign Revenue / Ad Spend
- Practical Example: An e-commerce store drops $5,000 on a Google Shopping campaign. It generates $25,000 in sales. The ROAS is simply $25,000 / $5,000, or a 5x return.
Gauging Long-Term Value Channels
Then you have the marathon runners: SEO and content marketing. These channels operate on a totally different principle. They build value slowly, creating assets that pay dividends for months, if not years. You absolutely have to measure their impact with a longer-term view.
Don't judge a long-term strategy by short-term metrics. SEO and content marketing are like planting an orchard, not harvesting a single crop. The initial investment is significant, but the cumulative return over time can far exceed that of short-term tactics.
Search Engine Optimization (SEO): The best way to calculate SEO’s ROI is often by figuring out what you would have paid for that organic traffic.
- Method: Calculate the equivalent cost of your organic traffic if you were buying it through PPC ads.
- Formula: (Value of Organic Traffic - SEO Investment) / SEO Investment
- Practical Example: A law firm invests $30,000 in SEO over six months. By month seven, their organic traffic is valued at $10,000 per month (based on what those keywords cost in Google Ads). Over a full year, that traffic is worth $120,000. The annual ROI is ($120,000 - $30,000) / $30,000, a solid 300%.
Content Marketing: Here, the ROI comes from tracking how your assets—blog posts, whitepapers, webinars—generate leads and sales over their entire lifespan.
- Method: You'll need your CRM and analytics firing on all cylinders to attribute closed deals back to specific pieces of content.
- Practical Example: A manufacturing company spends $5,000 to produce a highly detailed buyer's guide. Over the next two years, that guide generates 50 qualified leads. Five of those leads become customers, each with an average LTV of $10,000. The total revenue is $50,000. The ROI is ($50,000 - $5,000) / $5,000, an incredible 900%.
Looking at industry benchmarks can help set expectations and justify your budget allocations.
Typical Marketing Channel ROI Benchmarks
This table gives a high-level look at what you can generally expect from different channels in terms of ROI and the timeframe needed to see it.
| Marketing Channel | Average ROI (Return per $1 Spent) | Typical Measurement Timeframe | Primary KPIs |
|---|---|---|---|
| Email Marketing | $36 - $40 | 1-7 days | Open Rate, CTR, Conversion Rate, Revenue per Email |
| Paid Media (PPC) | $2 - $3 | 7-30 days | ROAS, CPA, Conversion Rate, Quality Score |
| SEO | Varies (Often highest long-term) | 6-12+ months | Organic Traffic, Keyword Rankings, Leads/Conversions |
| Content Marketing | Varies (Compounding value) | 3-12+ months | Leads Generated, Asset Downloads, Time on Page, Attributed Revenue |
These numbers aren't set in stone, but they highlight the different "personalities" of each channel. Email marketing delivers that quick hit, while SEO is the long-term investment that nearly half of businesses cite as their top ROI driver. Some B2B content strategies have even shown returns as high as 748% when measured over years, not months. Having this data-backed view is crucial for getting buy-in for those slower, compounding channels.
Choosing the Right Marketing Attribution Model
Once you’ve got a handle on your channel performance, the next question is always the same: who gets the credit? A customer might see a LinkedIn ad, read a blog post a week later, and finally click an email link to become a customer. Assigning value across that messy, real-world journey is what marketing attribution is all about.
Picking the right model isn't just an academic exercise. If you get it wrong, you could end up gutting the budget for a channel that’s quietly filling your funnel, simply because it doesn't get the "last click" glory.
Single-Touch Attribution: Simple, But Dangerously Incomplete
The easiest way to assign credit is with a single-touch model. It’s clean, it’s fast, and it gives 100% of the credit to one single interaction. But that simplicity comes at a steep price—you're often looking at a skewed, incomplete picture of what’s actually working.
First-Touch Attribution: This model gives all the credit to the very first interaction a person has with your brand. It’s fantastic for figuring out which channels are your best "introducers" and are great at generating initial awareness. The massive downside? It ignores everything that happened after that first hello.
Last-Touch Attribution: The polar opposite. Here, all the credit goes to the final touchpoint before someone converted. This model is great for identifying your "closers," but it completely overlooks all the hard work that warmed up the lead in the first place.
Think about a typical B2B buyer. They might find you through an organic search (first touch) but only convert three months later after seeing a retargeting ad (last touch). Neither model tells you the whole story of that journey.
Multi-Touch Attribution: A More Realistic View
Let's be honest: B2B sales cycles are complicated. They involve multiple decision-makers and dozens of touchpoints stretched over weeks or months. This is exactly where multi-touch attribution models shine, giving you a more balanced and accurate view by spreading credit across the entire buyer journey.
These models work from the assumption that every interaction plays some role in the final decision.
Linear Model: This one is straightforward—it just splits the credit evenly across all touchpoints. While simple, it incorrectly assumes every interaction is equally important.
U-Shaped (Position-Based) Model: This model gives more weight to the bookends of the journey: the first touch and the last touch (usually 40% each). The remaining 20% is distributed among all the interactions in the middle. It rightly values both the moment of discovery and the final push to convert.
W-Shaped Model: An evolution of the U-Shaped model, this one adds a third major milestone: lead creation. It typically assigns 30% credit each to the first touch, the lead creation touch, and the final conversion touch, with the remaining 10% split among the rest.
If you have a six-month sales cycle, a U-Shaped or W-Shaped model is going to give you a much more useful picture. You'll properly value the blog post that first caught their eye and the demo request that finally sealed the deal.
The Bottom Line: Multi-touch attribution gives you a far more nuanced understanding of a complex B2B journey. You avoid the trap of overvaluing closing channels while undervaluing the awareness-builders, which ultimately leads to much smarter budget decisions.
The Shift to Proving Cause and Effect
While attribution models are great for assigning credit based on correlation, the industry is quickly moving toward methods that prove causation. In a world with increasing privacy restrictions and signal loss, being able to prove that a marketing activity actually caused a lift in sales is the ultimate proof of its value.
Incrementality Testing: This is where you run a controlled experiment. You show an ad to a test group but not to a similar control group. The difference in conversion rates between the two is your "incremental lift"—the sales that wouldn't have happened without that ad. It's the gold standard for proving an ad's true impact.
Marketing Mix Modeling (MMM): This is a top-down statistical approach. Instead of tracking individual users, MMM crunches historical data—like sales figures, ad spend, seasonality, and even economic trends—to figure out how much each channel contributed to the bottom line. It’s especially powerful for measuring the impact of offline or hard-to-track channels like TV ads or PR.
These advanced methods change the conversation from "which channel gets the credit?" to "what would have happened if we didn't run this campaign at all?" Answering that question is the strongest possible justification for your marketing spend.
Using Technology to Simplify ROI Measurement
Manually wrestling with data from spreadsheets, ad platforms, and your CRM isn’t just slow—it’s a recipe for disaster. If you're still relying on VLOOKUPs to piece together your marketing performance, you're working with a skewed picture. Today, getting a clear, reliable view of your marketing impact depends on integrated analytics and artificial intelligence.
These systems are the connective tissue that automates data aggregation, pulling everything from scattered sources into one cohesive dashboard. It’s not just about saving time (though the hours saved are immense). It’s about eliminating the human error that throws your ROI calculations off track, so your team can focus on strategy, not data entry.

The Rise of AI in Marketing Analytics
Artificial intelligence has moved from a buzzword to a practical tool that’s completely reshaping how we measure marketing ROI. AI-driven analytics platforms do more than just collect data; they spot the hidden patterns and insights a human analyst could easily miss.
One of the biggest game-changers here is predictive analytics. These tools crunch your historical data to forecast future campaign performance, giving you a smarter way to allocate your budget. Instead of waiting for a campaign to end before you know if it worked, you can make informed adjustments on the fly based on what the AI predicts is coming.
AI is also revolutionizing attribution. By sifting through thousands of customer touchpoints, AI models can paint a far more nuanced and accurate picture of which channels and campaigns are actually driving conversions.
Practical Benefits of a Tech-Driven Approach
Bringing in a modern analytics stack isn’t just about prettier charts; it’s about making smarter decisions that drive real business growth. The right tech delivers tangible advantages you can see on the bottom line.
- Deeper Personalization: When you truly understand customer behavior, you can create hyper-relevant messages that resonate, lifting conversion rates and building loyalty.
- Real-Time Budget Optimization: AI algorithms can automatically shuffle ad spend to your best-performing campaigns, ensuring every dollar is working as hard as it can.
- Sophisticated Analysis: Suddenly, complex methods like incrementality testing and marketing mix modeling—once the exclusive domain of massive enterprises—are within reach.
Adopting this kind of tech makes the entire ROI process far less painful. You can learn more about the importance of automating ad ops tasks for ROI calculation and why it's a no-brainer.
The shift is happening fast. By 2025, estimates suggest that anywhere from 30% to over 80% of marketers were already using AI for attribution and personalization. Some firms even saw ROI jump by as much as 76% by letting AI optimize their campaigns.
But there’s a catch: as few as 36% of leaders feel they can accurately measure ROI. This gap is fueling massive investment in the measurement platform market, which is expected to balloon from $4.6 billion in 2025 to $16.4 billion by 2034. The pressure is on to get this right.
Work Smarter, Not Harder
At the end of the day, folding technology into your measurement framework is about getting more done with less manual grind. It’s the difference between reactive reporting and proactive, data-informed strategy.
For instance, AI can be a powerful ally for pinpointing high-intent prospects, which is fundamental to building a healthy pipeline. You can see these concepts in action in our guide on AI-powered lead generation.
The goal is to build a reliable system that consistently serves up actionable insights. Technology automates the tedious work of gathering and cleaning data so you can spend your time where it counts: interpreting the results, making strategic calls, and proving marketing’s value to the rest of the business.
Building Dashboards That Drive Action
You can have the most accurate data and the slickest ROI calculations in the world, but if they're buried in a spreadsheet, they're dead weight. The final, and arguably most important, step is turning all that raw data into a clear story that actually drives decisions. This is where a well-designed dashboard becomes your best friend.
A great dashboard doesn't just show you numbers. It gives you context. It answers the one question your leadership team really cares about: "So what?" It’s the bridge between marketing activities and real business outcomes, translating complex performance data into a simple narrative about what's working, what isn't, and where the next dollar should go.

Tailoring Your Dashboard for the Right Audience
One of the biggest mistakes I see marketers make is building a one-size-fits-all dashboard. Your CEO and your PPC manager care about completely different things, and your reporting has to reflect that reality. When you try to show everyone the same data, you end up with a cluttered, confusing report that helps no one.
Effective dashboards are always built for a specific audience.
- For the C-Suite (Executive View): Leadership needs the 30,000-foot view. They’re focused on the bottom line—not daily campaign tweaks. Their dashboard should be a clean, high-level summary that directly connects marketing spend to revenue and profit.
- For the Marketing Team (Operational View): Your team, on the other hand, lives in the weeds. They need the granular details to optimize campaigns. Their dashboard is a diagnostic tool, helping them see performance at the channel, campaign, and even ad level to find opportunities for improvement.
The goal is to provide clarity, not complexity. An executive dashboard should answer strategic questions in under 60 seconds. A marketing team dashboard should enable your channel managers to make smart tactical adjustments with confidence.
Key Metrics for Different Audiences
To make this more concrete, let’s look at which metrics belong on which dashboard. The table below illustrates how the executive view focuses on outcomes, while the team view zeroes in on the performance drivers that produce those outcomes.
This breakdown is a simple but powerful way to ensure everyone gets the information they need without the noise.
Sample Marketing ROI Dashboard Metrics
| Metric Category | Executive-Level Metrics (High-Level) | Marketing Team Metrics (Granular) |
|---|---|---|
| Overall Performance | Total Marketing ROI, LTV:CAC Ratio, Pipeline Contribution | Channel-Specific ROI, Cost Per Lead (CPL) by Channel, Lead-to-MQL Rate |
| Acquisition | Customer Acquisition Cost (CAC), Net New Customers Acquired | Click-Through Rate (CTR), Cost Per Click (CPC), Website Conversion Rate |
| Financials | Revenue Attributed to Marketing, Marketing Spend vs. Budget | Return on Ad Spend (ROAS), Campaign-Level Spend and Pacing |
| Funnel Health | Sales Cycle Length, Total Marketing Qualified Leads (MQLs) | MQL-to-SQL Conversion Rate, Content Asset Performance (Downloads) |
Building out these separate views is fundamental. If you're looking for a deeper dive into creating these visuals, exploring professional reporting and analytics services can show you how to structure data for maximum impact.
Establishing a Cadence for ROI Review
A dashboard isn't a "set it and forget it" report; it's a living tool. To truly embed data into your operations, you need a consistent rhythm for reviewing performance and making decisions. A quarterly ROI reporting meeting is the perfect way to do this.
This isn’t about just reading numbers off a slide. It’s a strategic working session. A solid agenda keeps the conversation focused on insights and, most importantly, action.
Impact Opportunity
A well-run quarterly ROI review meeting turns measurement from a reactive chore into a proactive strategic lever. You create a dedicated forum to discuss what the data means, shifting the focus from simply reporting metrics to using them to make smarter budget calls, pivot away from losing channels, and double down on what’s actually driving growth. This operational rhythm ensures your ROI calculations directly shape the future of your marketing.
Here’s a simple agenda to keep things on track:
- Executive Summary (5 minutes): Start with the headlines. What was our overall marketing ROI? How’s our LTV:CAC ratio? Did we hit our quarterly goals?
- Performance Deep Dive (15 minutes): Dig into channel-level performance. Highlight the big wins and call out the areas that are struggling.
- Key Insights & Learnings (10 minutes): This is the "why" behind the numbers. What did we learn this quarter? What surprised us?
- Proposed Actions & Budget Adjustments (15 minutes): Based on the data, what are we going to do about it? Present clear recommendations. “We propose shifting 15% of the budget from Channel X to Channel Y because…”
- Open Discussion & Next Steps (5 minutes): Get alignment on the action items and assign owners to make sure it all gets done.
Even with the best framework, measuring marketing ROI can feel messy. You're not alone. Certain questions pop up again and again, especially when you're trying to apply textbook formulas to the chaos of real-world marketing.
Getting these tough questions right is what separates a measurement system that looks good in a spreadsheet from one that actually drives growth. Let’s tackle the most common ones head-on.
What Is a Good Marketing ROI Benchmark?
Everyone wants to know the magic number, but the honest answer is: it depends.
A "good" ROI isn't a universal constant. It's a range that shifts dramatically depending on your industry, business model, and especially your profit margins. A 3:1 ratio might be phenomenal for a low-margin e-commerce brand, but a B2B SaaS company with high margins should be aiming for 5:1 or even higher.
The most common benchmark you'll hear is a 5:1 revenue-to-marketing spend ratio—generating $5 for every $1 you put in. But treat that as a loose guideline, not gospel.
What really matters for your business?
- Profit Margins: High-margin businesses can stomach a lower ROI and still be very profitable. If your margins are thin, your ROI target has to be higher.
- Industry: Competing in a crowded space? Your customer acquisition costs are probably higher, which will naturally lower your average ROI.
- Business Stage: A startup trying to grab market share might happily accept a lower ROI today in exchange for rapid growth tomorrow.
The Real Metric to Obsess Over: Forget generic benchmarks. Focus on your internal LTV:CAC ratio. A healthy, sustainable business model typically needs an LTV that is at least 3x your CAC. This is a far better pulse check on your growth engine than comparing your numbers to a vague industry average.
How to Measure the ROI of Brand Marketing?
This is where traditional measurement breaks down. Brand marketing—things like PR, top-of-funnel content, or event sponsorships—rarely leads to an immediate click and conversion.
If you rely on last-touch attribution, your brand marketing ROI will almost always look like zero. That doesn’t mean it isn’t working; it just means you’re measuring it the wrong way.
Instead of hunting for direct revenue, you need to track leading indicators—metrics that signal long-term growth and rising brand equity.
- Share of Voice (SOV): Are you being mentioned online more than your competitors? Tools that track SOV can show if you're capturing more of the conversation in your market, which often precedes market share growth.
- Direct and Branded Search Traffic: Track this in Google Analytics. A steady increase in people searching directly for your company name or products is one of the strongest signals that your brand-building is paying off.
- Surveys and Brand Recall: Run simple surveys to your target market. Ask them to name companies in your space. Are more of them naming you, unprompted, than six months ago? That’s brand recall, and it’s pure gold.
These metrics won't give you a simple ROI calculation, but they offer powerful, directional proof that your investment is building a critical asset: a brand people recognize and trust.
How Do I Get Started with Limited Data or Resources?
You don't need a six-figure analytics budget or a team of data scientists to get started. The biggest mistake is trying to boil the ocean. If you’re feeling overwhelmed, just focus on what you can track accurately right now.
Start small, prove value, and then expand.
Practical Example
Let's imagine you're a small B2B services firm with a pretty basic tech stack.
- Pick One Channel: Don't try to measure everything. Just focus on your most important channel—let's say it's Google Ads. Get really good at tracking its ROAS before you worry about anything else.
- Embrace UTM Parameters: This is the simplest, most effective, and free way to see what's working. Tag all your campaign URLs so you can see in Google Analytics which specific ads, emails, or social posts are actually driving traffic and leads.
- Set Up a Basic CRM: Even a free CRM like the one from HubSpot is a game-changer. It helps you connect a lead from a specific source to a closed deal. While you're at it, add a "How did you hear about us?" field to your contact form. It's not perfect data, but it gives you invaluable first-touch insights.
The goal here is to create a small, contained win. When you can walk into a meeting with a clear report showing a 400% ROAS from your first Google Ads experiment, your request for more budget is no longer a vague ask. It's a proven investment.
This incremental approach lets you demonstrate real impact, get buy-in from leadership, and scale your measurement capabilities as you grow.
Ready to transform your marketing measurement from a guessing game into a predictable revenue engine? The team at Prometheus Agency helps growth leaders turn complex data into clear, actionable strategies. We combine AI enablement and CRM expertise to build systems that prove ROI and drive scalable growth. Start with a complimentary Growth Audit to see how we can help. Learn more at prometheusagency.co.