You've just reviewed a polished journey diagram in a leadership meeting. Every stage looks mapped, every persona has a path, and the dashboard shows plenty of activity. Then someone asks why qualified pipeline is flat, why handoffs still break, and which touchpoint moved a deal forward. Nobody can answer from the map.
Why Most AI Journey Maps Fail Before They Start
That meeting fails for a structural reason. Teams often treat AI customer journey mapping as a better drawing exercise, so they buy software, run a workshop, and produce a cleaner version of the journey they intended customers to take. Revenue operations still can't use it to route leads, prioritize accounts, or fix a broken handoff.
The blind spot is large. Approximately 40% of real customer touchpoints are missing from traditional journey maps according to a 2025 academic paper on AI-powered customer journey intelligence, while 83% of executives say they need better tools to determine what drives purchases in that same cited research summary. If two-fifths of the journey is invisible, attribution, budget decisions, and CRM workflows are built on a partial story.
Static Journey Map vs AI Journey Intelligence
| Dimension | Static Journey Map | AI Journey Intelligence |
|---|---|---|
| Update cadence | Periodic workshop or quarterly refresh | Continuously updated from live signals |
| Data sources | Interviews and selected analytics | CRM, web, campaigns, service, product, transactions |
| Primary output | Diagram of an intended path | Predictions, alerts, and next actions |
| Measurement | Activity by stage | Incremental impact against a control |
The shift that matters is operational, not visual. A useful system connects signals to decisions inside the CRM and service workflows your teams already run, then proves whether an intervention changed an outcome.
A map describes a journey. An operating system changes what happens next in it.
Key Takeaways
- Missing touchpoints distort decisions: Unobserved interactions hide friction and misattribute revenue.
- Visualization isn't value: Value appears when insight triggers a workflow change.
- Mapping becomes intelligence: The goal is a living system tied to pipeline, retention, and service cost.
What AI Customer Journey Mapping Actually Means
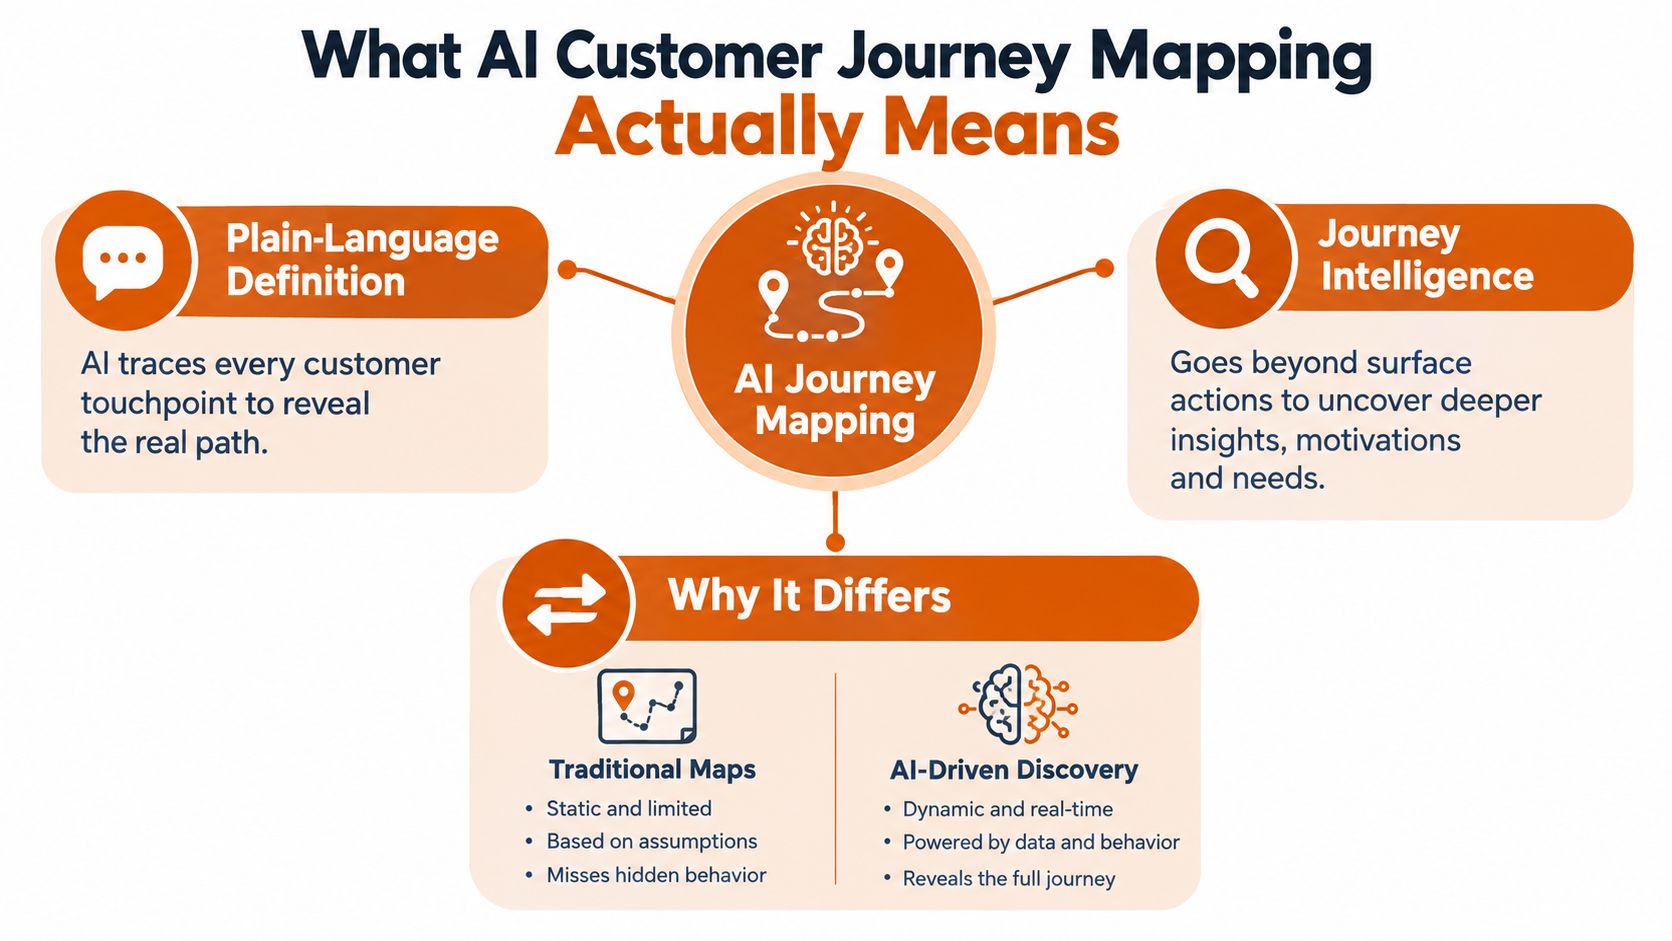
In plain language, AI customer journey mapping uses models to reconstruct the actual path customers take across channels, detect where that path breaks, and recommend or trigger the next action. It doesn't start with the path marketing designed. It starts with evidence from behavior.
A paper road map is the right analogy for the old approach. It's accurate until traffic, closures, and detours make it obsolete. Journey intelligence works like live navigation, because it ingests new signals, recalculates likely routes, and reroutes your response while the customer is still moving.
The Four Layers of a Working System
- Data unification: Behavioral, transactional, engagement, and contextual records resolve to one person and one account.
- Behavioral modeling: Models find sequences, segments, and drop-off points that manual analysis misses.
- Decision activation: A propensity score or intent signal triggers routing, content, outreach, or service action.
- Measurement feedback: Outcomes flow back so the system learns which intervention worked, and for whom.
Adoption context supports building this as infrastructure rather than an experiment. 78% of organizations used AI in at least one business function in 2025, up from 72% in 2024, with marketing and sales among the most common areas, according to McKinsey research cited in SAS industry coverage. That breadth matters because journey signals live across functions, not inside one team's tool.
For teams assessing where experience data hides commercial signal, it's worth learning to find revenue opportunities in CX data before selecting models. The business targets should stay explicit throughout, including pipeline velocity, retention, expansion, and service cost. If a proposed use case can't name which of those it moves, it's a reporting project, not journey intelligence.
The Four AI Techniques That Power Journey Intelligence
Four techniques do most of the work, and they solve different problems. Teams get into trouble when they buy one capability, usually lead scoring, and call the whole system done.
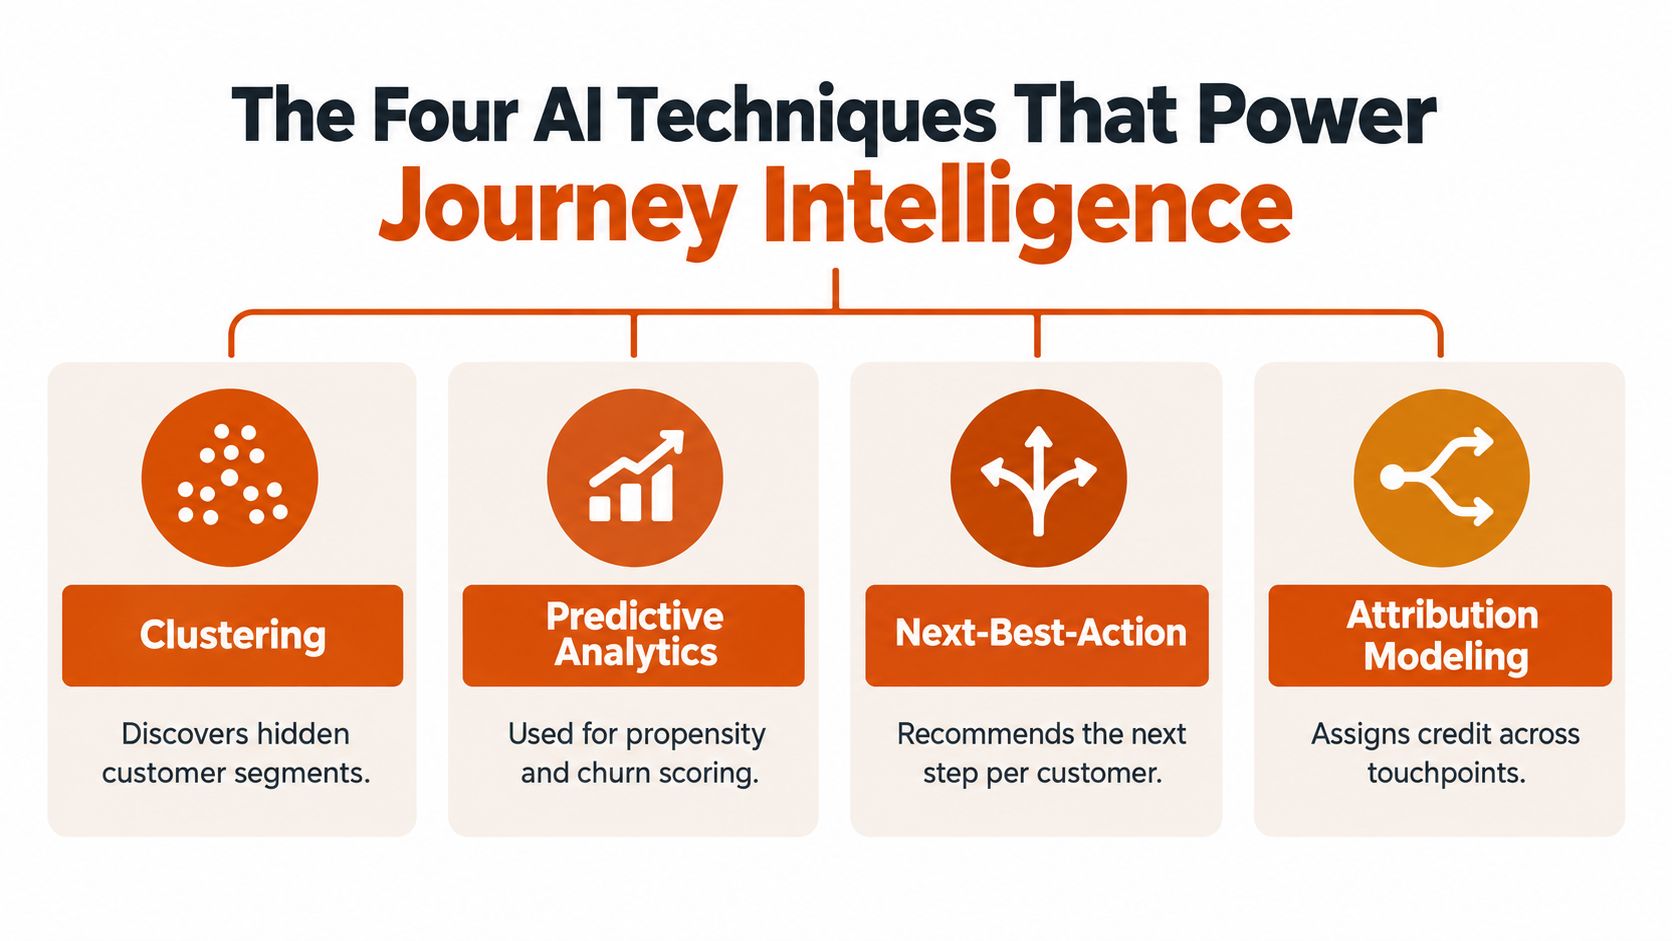
Clustering groups accounts and contacts by observed behavior instead of firmographic labels alone. In practice, it surfaces people your taxonomy never anticipated. Anonymous visitors from one account who repeatedly read integration and security pages, for example, often reveal an untracked technical stakeholder who should receive different content than the economic buyer.
Predictive analytics estimates a future outcome, such as conversion, churn, or next purchase. A renewal model might combine declining product usage, fewer active users, and unresolved tickets into a risk score. The score itself doesn't save the account, but it buys your customer success team time to intervene while a save is still possible.
From Prediction to Action and Interpretation
A next-best-action engine converts a prediction into a specific intervention, channel, and sequence. Measured results get concrete here. A telecommunications deployment of sequenced touchpoints produced a 5% increase in incremental revenue, a 30% margin impact one year after launch, and click-through rates two to three times higher than traditional campaigns, as reported in McKinsey research on next-best-experience programs.
Natural language processing reads the unstructured evidence your structured fields ignore. It classifies intent and urgency across sales calls, support tickets, chat, and email. Escalation language in a service transcript, budget objections on a call, or repeated implementation questions all become journey events your models can use.
This walkthrough shows how those signals combine in a working journey view.
Sequence the build for visible signal within one quarter. Start with clustering plus one propensity model tied to a revenue outcome, add next-best-action for a single segment, then layer NLP once your team trusts the underlying events. Attribution modeling belongs in the stack too, but credit assignment without an action engine only produces better arguments about the past.
Instrumenting the Data Layer for Cross-Channel Visibility
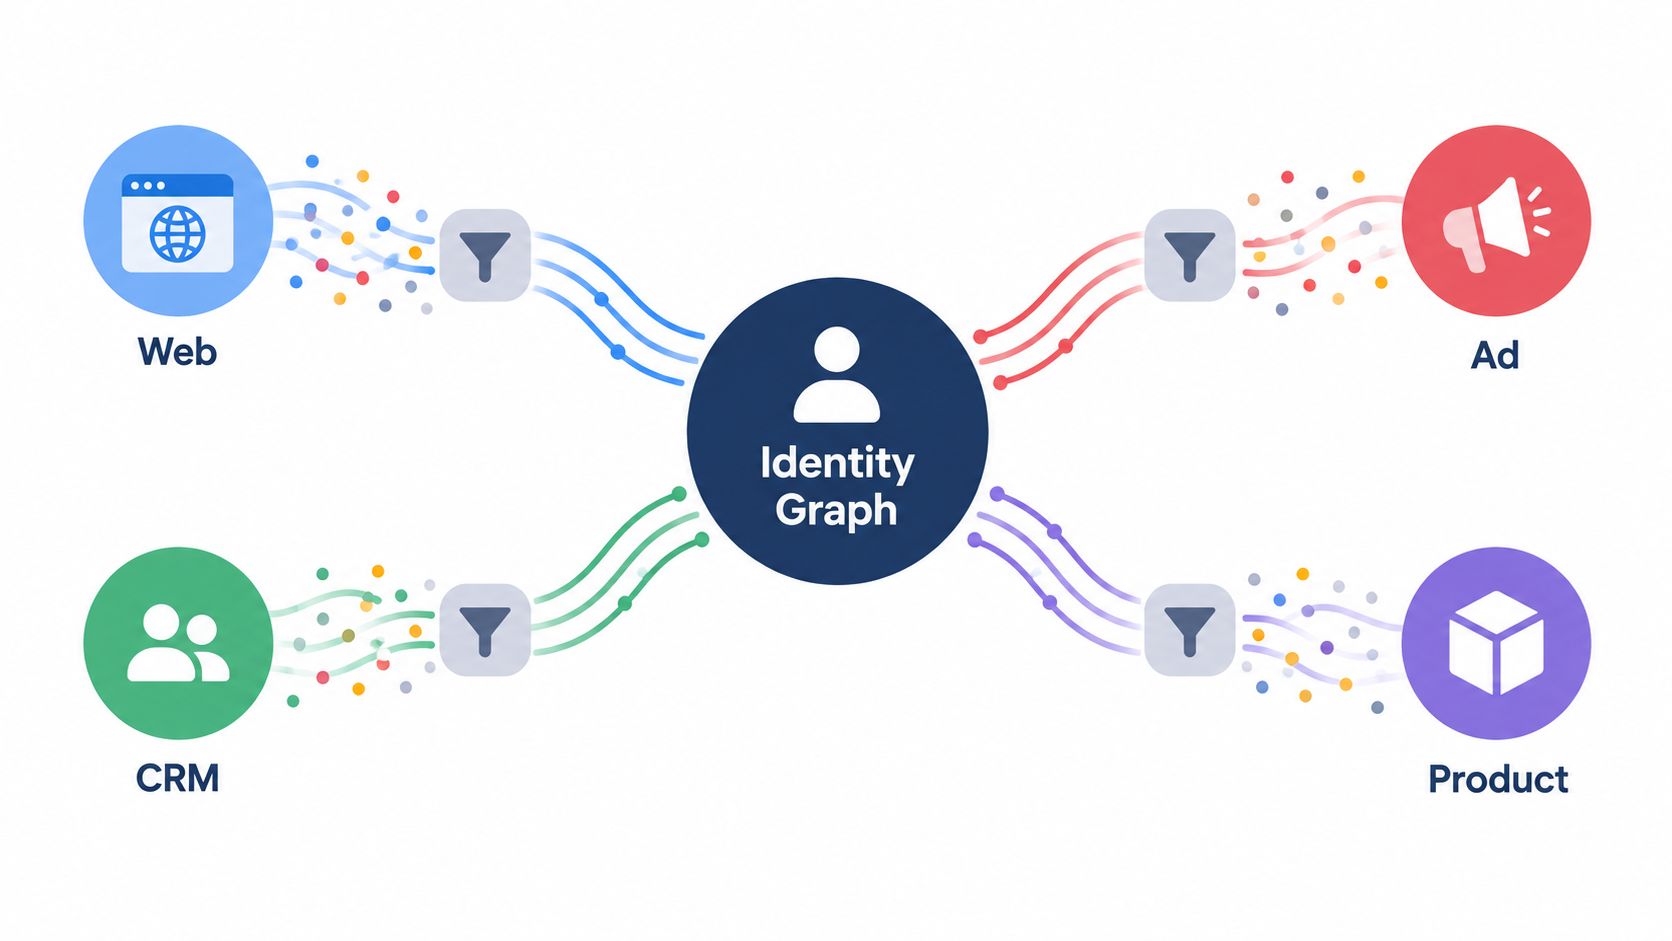
Models can't repair broken instrumentation. If web, advertising, CRM, and product systems can't agree on who acted, when, and under which account, AI will confidently misattribute revenue and route good accounts to the wrong owner.
The channel problem is unforgiving. Roughly two-thirds of customers use multiple channels during a buying journey and 40% will not do business with a company that cannot provide touchpoints through their preferred channels, according to Salesforce connected customer research. A buyer sees an ad, reads a specification page, emails a colleague, talks to sales, and later opens a support case. Your systems must read that as one journey.
An Instrumentation Checklist for B2B Teams
- Identity resolution: Match anonymous sessions, known contacts, and offline activity to a person and account graph.
- Event standards: Capture timestamps, channel metadata, campaign identifiers, and experiment IDs on every meaningful action.
- CRM integration: Write scores, evidence, and recommended actions back into records reps and success managers already open.
- Consent capture: Store permission status and purpose with the event, and apply data minimization by market.
- Post-sale telemetry: Include onboarding milestones, product usage, support contacts, and resolution outcomes.
The design work behind customer data platform integration determines whether these pieces operate as one account view or five partial ones. Pay special attention to offline sales activity, because field conversations and partner referrals are where B2B journeys most often disappear from the record.
Run a quick audit before modeling anything. Pick ten recently won and ten recently lost opportunities, then reconstruct each journey manually from your systems. Count the events you know happened but can't find, and fix those gaps first.
Choosing KPIs That Prove AI Changed Outcomes
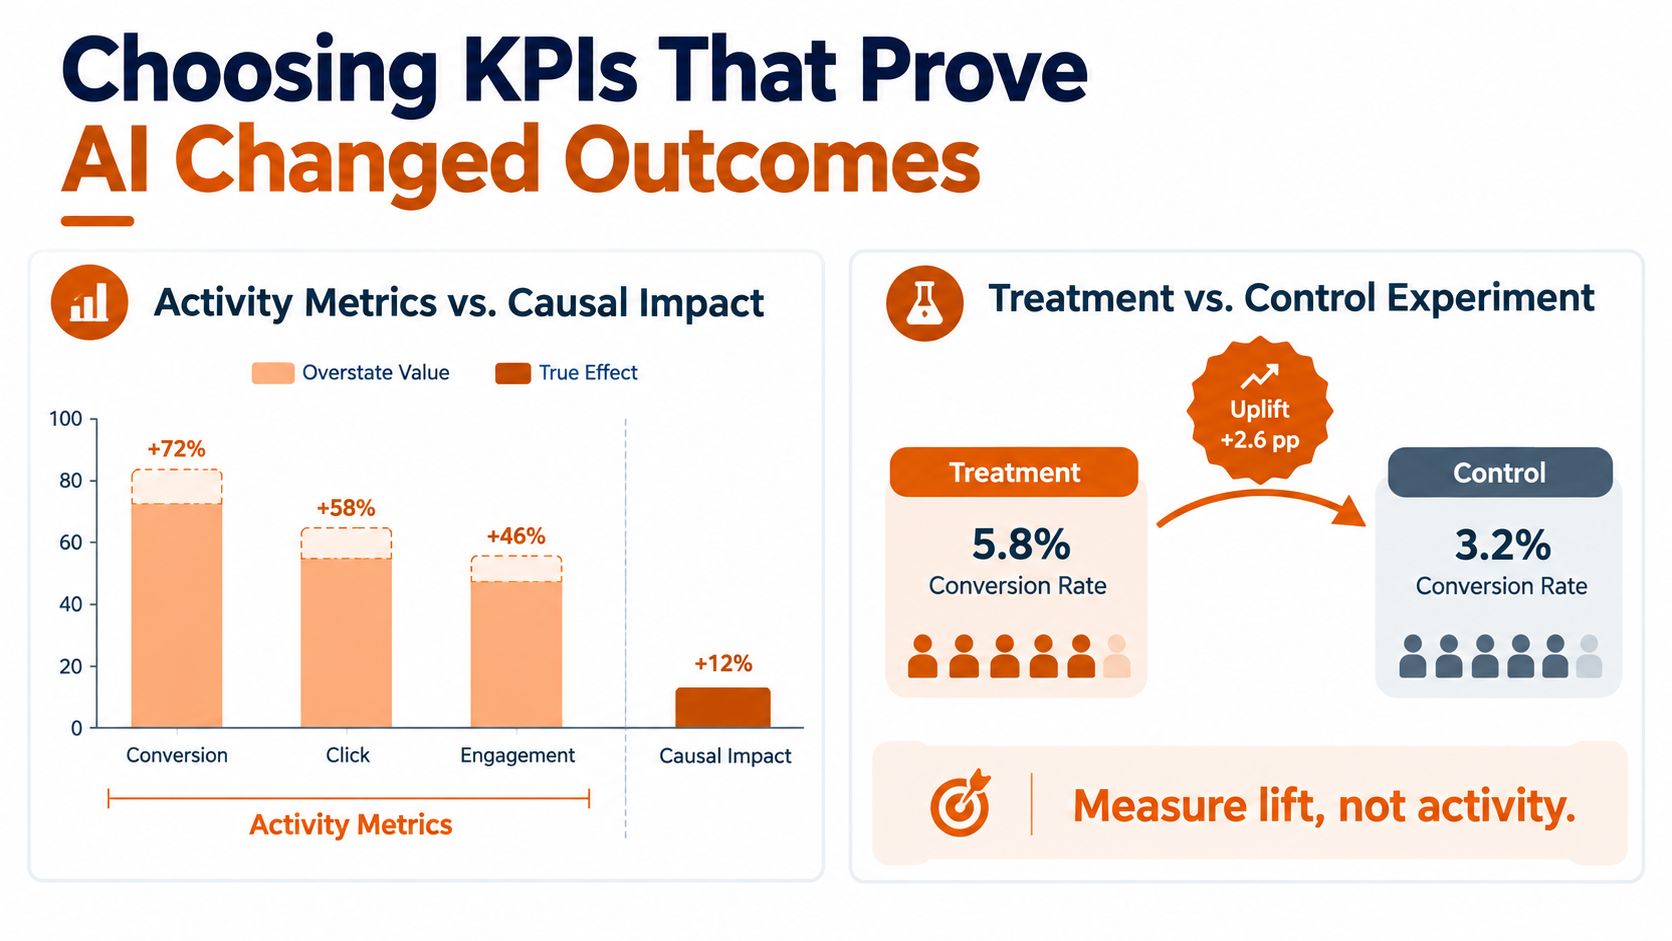
Activity dashboards flatter AI programs. Opens, clicks, and even raw conversions rise when you target people who were already likely to buy, so the dashboard credits the model for demand it didn't create. That's how teams defend programs that haven't changed economics.
Personalization shows why discipline matters. McKinsey reports that personalization commonly produces a 10 to 15% revenue lift, with company-specific effects ranging from 5% to 25%, while 76% of consumers say personalized communications influence brand consideration and 78% say they increase repurchase likelihood, according to McKinsey research on the value of personalization. Self-reported influence and observed engagement still don't prove your intervention caused the lift.
Vanity Metrics vs Causal Evidence
| Question | Activity Metric | Causal Alternative |
|---|---|---|
| Did outreach work | Click or reply rate | Incremental meetings vs holdout |
| Did scoring work | Leads passed to sales | Opportunity velocity by score band |
| Did retention work | Save plays launched | Renewal lift vs matched control |
| Did service AI work | Tickets deflected | Resolution outcome and repeat contacts |
Use treatment-control experiments wherever volume allows, supported by uplift modeling to find segments where treatment changes behavior rather than segments already inclined to act. Pair every primary KPI with guardrails, including unsubscribe rate, complaint rate, margin, and contact frequency. An intervention that lifts conversion while burning margin or trust hasn't succeeded.
Practical rule: Fund the next phase on holdout-validated lift, not on dashboard volume.
Prioritize interventions where four conditions overlap. You need model confidence, reachable audience, economic value, and operational readiness in the same use case. Tie each journey stage to a value-weighted outcome such as expected lifetime value, opportunity velocity, first-contact resolution, or net revenue retention. That framing gives a CFO incremental pipeline and margin to evaluate, instead of a larger lead count of unknown quality.
Governance, Trust, and the Human Override
More personalization doesn't automatically mean a better journey. Customers accept relevant help when the benefit is tangible and the data use is visible. They reject relevance that feels extracted from opaque surveillance, and B2B buyers carry that reaction into vendor evaluations.
The trust constraint is measurable. In a seven-country study of 5,000 consumers and 500 executives, 65% of executives said data-privacy rules limit AI personalization, 54% reported declining trust in companies' handling of personal data, and 30% of consumers said AI-led personalization had detracted from their experience, according to the Verizon 2025 CX Annual Insights report. Governance therefore belongs in journey design, not in a legal review at launch.
Mapping Trust Thresholds at Each Stage
For every AI-enabled touchpoint, document six fields before it ships.
- Data requested: What's collected, and is it necessary for this action?
- Inference made: What does the model conclude, and with what confidence?
- Action taken: Does AI recommend, decide, or act autonomously?
- Explanation offered: Can the customer and the employee see why it happened?
- Opt-out available: Can the customer decline without losing core service?
- Human escalation path: Who takes over, and how quickly?
This structure aligns with a disciplined approach to human in the loop AI governance, where autonomy expands only as evidence and controls mature. Keep the boundary explicit for decisions affecting pricing, eligibility, account status, or customer treatment.
Automate classification, prediction, summarization, and recommendation first. Keep consequential decisions behind a named human approver.
Consider a churn intervention. AI can detect declining usage plus unresolved issues, summarize the evidence in the CRM, and draft an executive outreach sequence. A customer success leader should approve the message and the offer before anything reaches a strategic account. Record data provenance, confidence scores, approval requirements, and fallback paths for low-confidence cases. Then measure complaint rates, abandonment, and opt-outs alongside conversion, because a journey that performs while eroding trust is borrowing against future revenue.
Practical Examples From Acquisition and Retention
Two operating stories show how the same architecture serves opposite ends of the lifecycle. Both start with sequence detection, but they capture value through different workflow changes.
Acquisition Example in B2B Manufacturing
A niche manufacturer entering the U.S. market couldn't tell serious evaluators from casual form fills. Its journey system linked ad exposure, technical specification page views, webinar attendance, email responses, and sales activity at the account level. Clustering and propensity modeling found that prospects who viewed specifications, attended a webinar, and then requested an implementation discussion converted at a meaningfully higher rate than prospects who only submitted a generic form.
That sequence changed routing. Accounts showing the pattern went to a technical seller with the evidence attached, while generic inquiries entered nurture. Media planning followed the same logic, and teams evaluating paid search structure can borrow discipline from guidance on how to structure Performance Max campaigns by separating high-intent asset groups from broad discovery. The pattern here mirrors an omni-channel ABM engine that doubled qualified leads for a niche B2B company entering the U.S. market, because budget and sales time concentrated on accounts demonstrating buying behavior.
Retention Example in Post-Sale Service
An industrial equipment provider faced the opposite problem. Customers kept contacting agents for installation specifications that already existed in manuals, but the information was hard to find and poorly formatted. Journey analysis across search behavior, knowledge-base usage, chat, and repeat contacts exposed the pattern, and NLP classified the underlying intent.
The fix combined retrieval with escalation rules. AI returned the relevant passage personalized by equipment model, while safety and warranty questions went straight to a human. That restraint matters because 53% of customers believe generative AI will help companies serve them better, but only 37% trust AI outputs to be as accurate as an employee and 81% want a human involved in reviewing and validating AI-generated outputs, according to Salesforce research on connected customer experience.
Both examples depend on customer journey orchestration that spans marketing, sales, and service rather than optimizing one channel. Note what each team measured. Acquisition tracked qualified pipeline and lead-to-opportunity velocity, while service tracked deflection, first-contact resolution, repeat contacts, resolution time, and cost per case. The operating change, not the model, captured the value in each story.
A 90-Day Implementation Roadmap for Growth Leaders
Ninety days is enough to prove value if you resist boiling the ocean. The sequence below favors one measurable pilot over a platform rollout nobody adopts.
Days 1 to 30 Build the Foundation
Audit data quality, identity resolution, and event coverage using the won-and-lost reconstruction exercise. Define journey stages around revenue outcomes such as qualified pipeline, renewal, or expansion, and assign a named owner for data, modeling, and frontline adoption. Don't select the pilot yet, because the audit usually reveals where evidence is strong enough to support one.
Days 31 to 60 Run One Controlled Pilot
Pick a single high-value use case in one segment, such as churn propensity for mid-market accounts or next-best-action for technical evaluators. Launch with a holdout group, one primary KPI, and defined guardrails for complaints, margin, and contact frequency. Review results weekly with sales or success leaders in the room, and log every human override so you learn where the model misreads context.
Days 61 to 90 Scale What Survived Testing
Expand only the interventions that beat the control. Integrate scores, evidence, and approvals into existing CRM and customer success workflows, set a governance cadence for consent and model review, and publish an escalation path for low-confidence decisions.
The benchmark for ambition is realistic. McKinsey found that 40% of leading organizations reported significantly improved customer-experience scores over the prior 12 months, compared with 12% of lagging organizations, and 42% of surveyed organizations reversed rising inbound volumes through smarter self-service and digital deflection, according to McKinsey research on AI in customer care.
Impact opportunity: A disciplined pilot reduces manual analysis, shortens lead-to-appointment time, lowers cost per qualified lead, and produces holdout-validated pipeline lift you can defend. That's the evidence base for scaling, and it's worth more than any diagram.
Prometheus Agency helps growth leaders rebuild AI customer journey mapping as a closed-loop revenue system, connecting AI enablement, CRM optimization, and go-to-market workflows to holdout-measured pipeline and retention outcomes. If your current map can't explain which intervention moved revenue, visit Prometheus Agency to start with a complimentary Growth Audit and AI strategy session.